How to create a truly real time report in GA4 within 5 mins
Creating a custom real time report in GA4
In the world of the internet, we need to be quicker than ever before. We want to make timely posts on social media and our website. To do this, we require instant information that gives us insights.
If you are frustrated with the limitation from GA4 real time report in the interface, you have come to the right place.
At the moment, there are three different way for you to pull real time report
- The real time report in the interface
- The Real Time Reporting API
- Using BigQuery
While using method #1 and #2 might still face quite a lot of limitation and accuracy issue at the moment, using BigQuery seems a bit hectic for most user.
Therefore, in this article, we are going to explain how can we use BigQuery to create real time data and report it in looker studio! Once you learn this easy step, you can also create your own real time report using BigQuery in your own reporting dashboard!
The setup is divdied into following steps:
- configure the streaming data in GA4
- configure the streaming table in BigQuery
- creating the visualisation pipeline in Looker Studio.
So let’s get started!
Configuration in GA4
Make sure the right setup in GA4.
Step1: Go to your BigQuery Integration in GA4
Go to Admin » BigQuery Links »
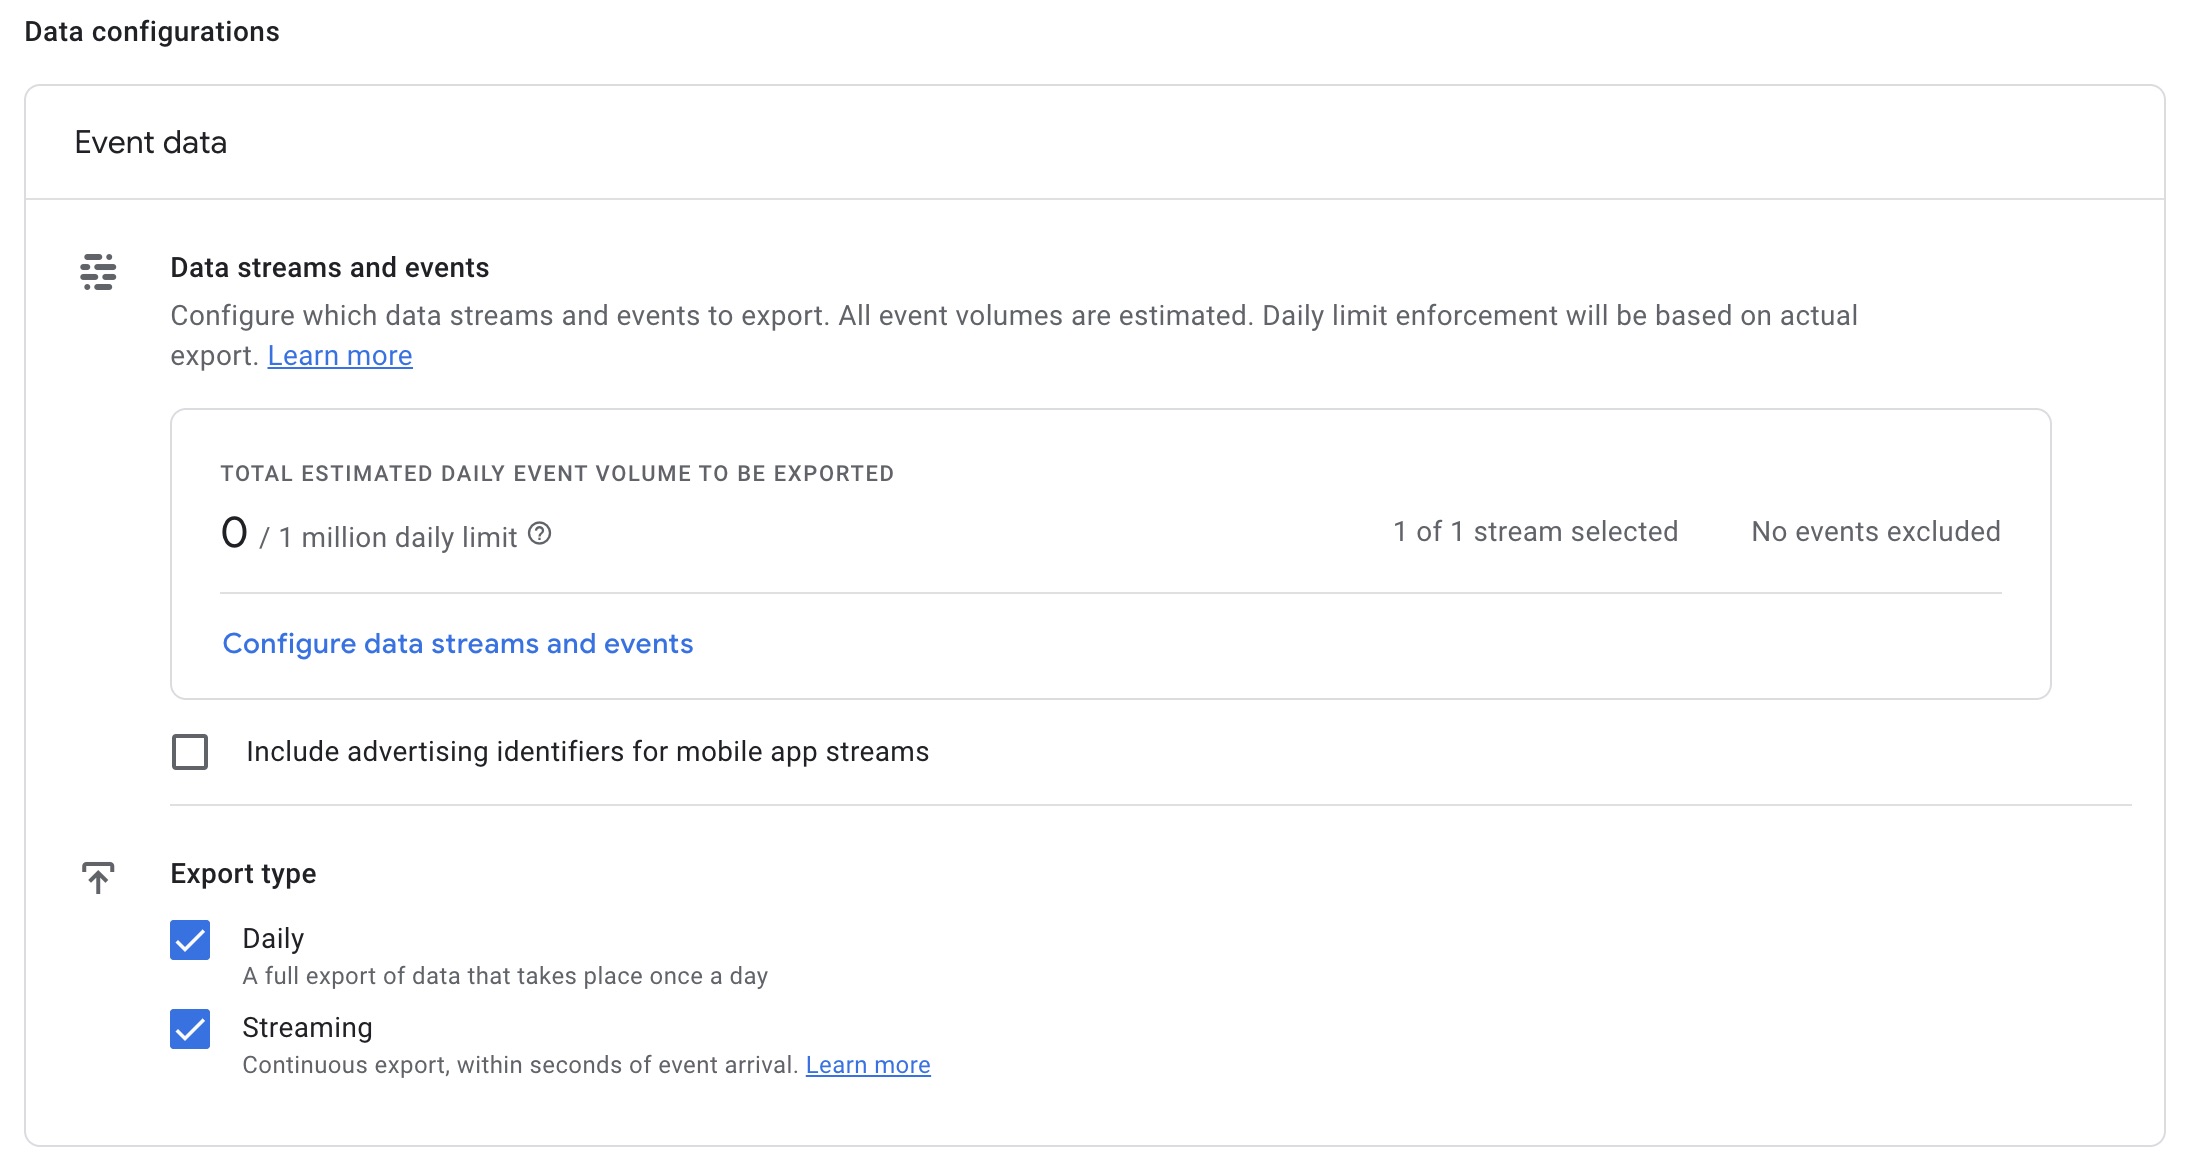
make sure under export type, you have ticked streaming.
Please notice streaming service will incur extra cost, so please evaluate before using it.
Configuration in BigQuery
Configurating the data source in BigQuery
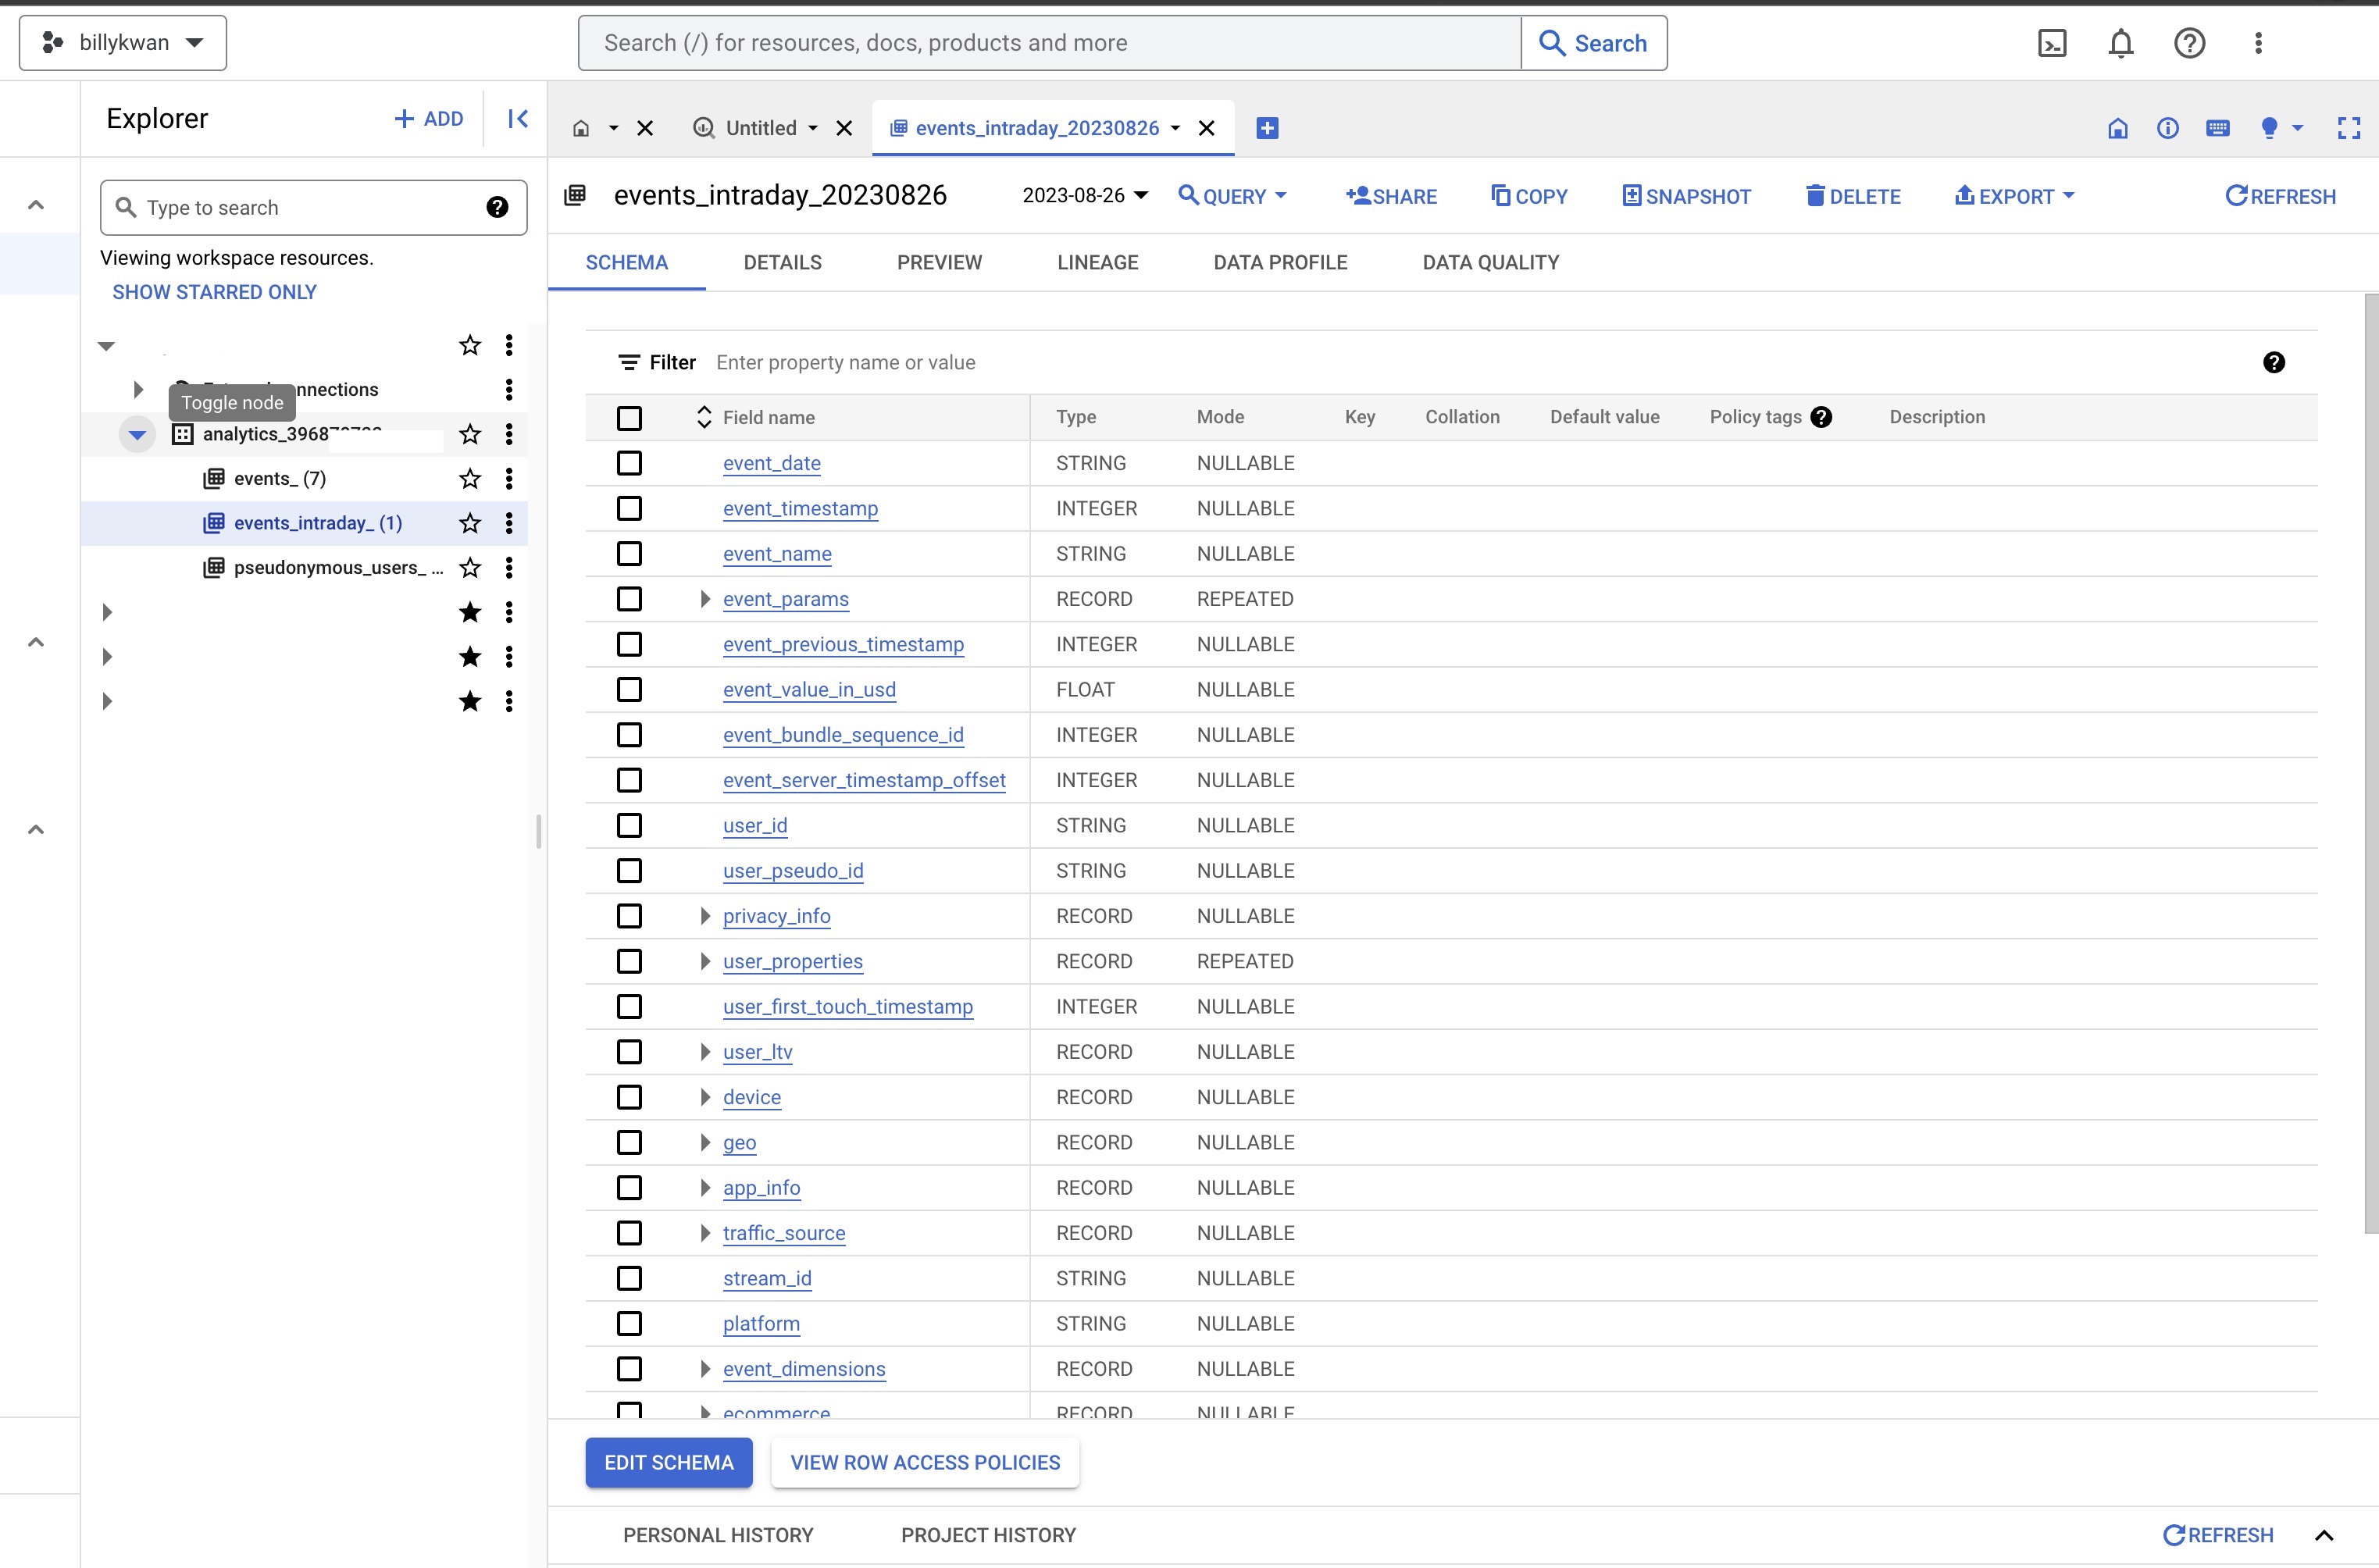
Step2: Go to your BigQuery to locate your real time dataset
The table name should look some like “events_intraday_(1)” If you do not know how to navigate to BigQuery and the usage of BigQuery. Feel free to have a look at these amazing guideline from line Tutorial from Hevo Data Tutorial from dbvis
Step3: Create a SQL query to run your required real time data
Create your desired query for the real time report. Now writing SQL might be a tricky part, but trust me, this is the only technical part for setting up real time report.
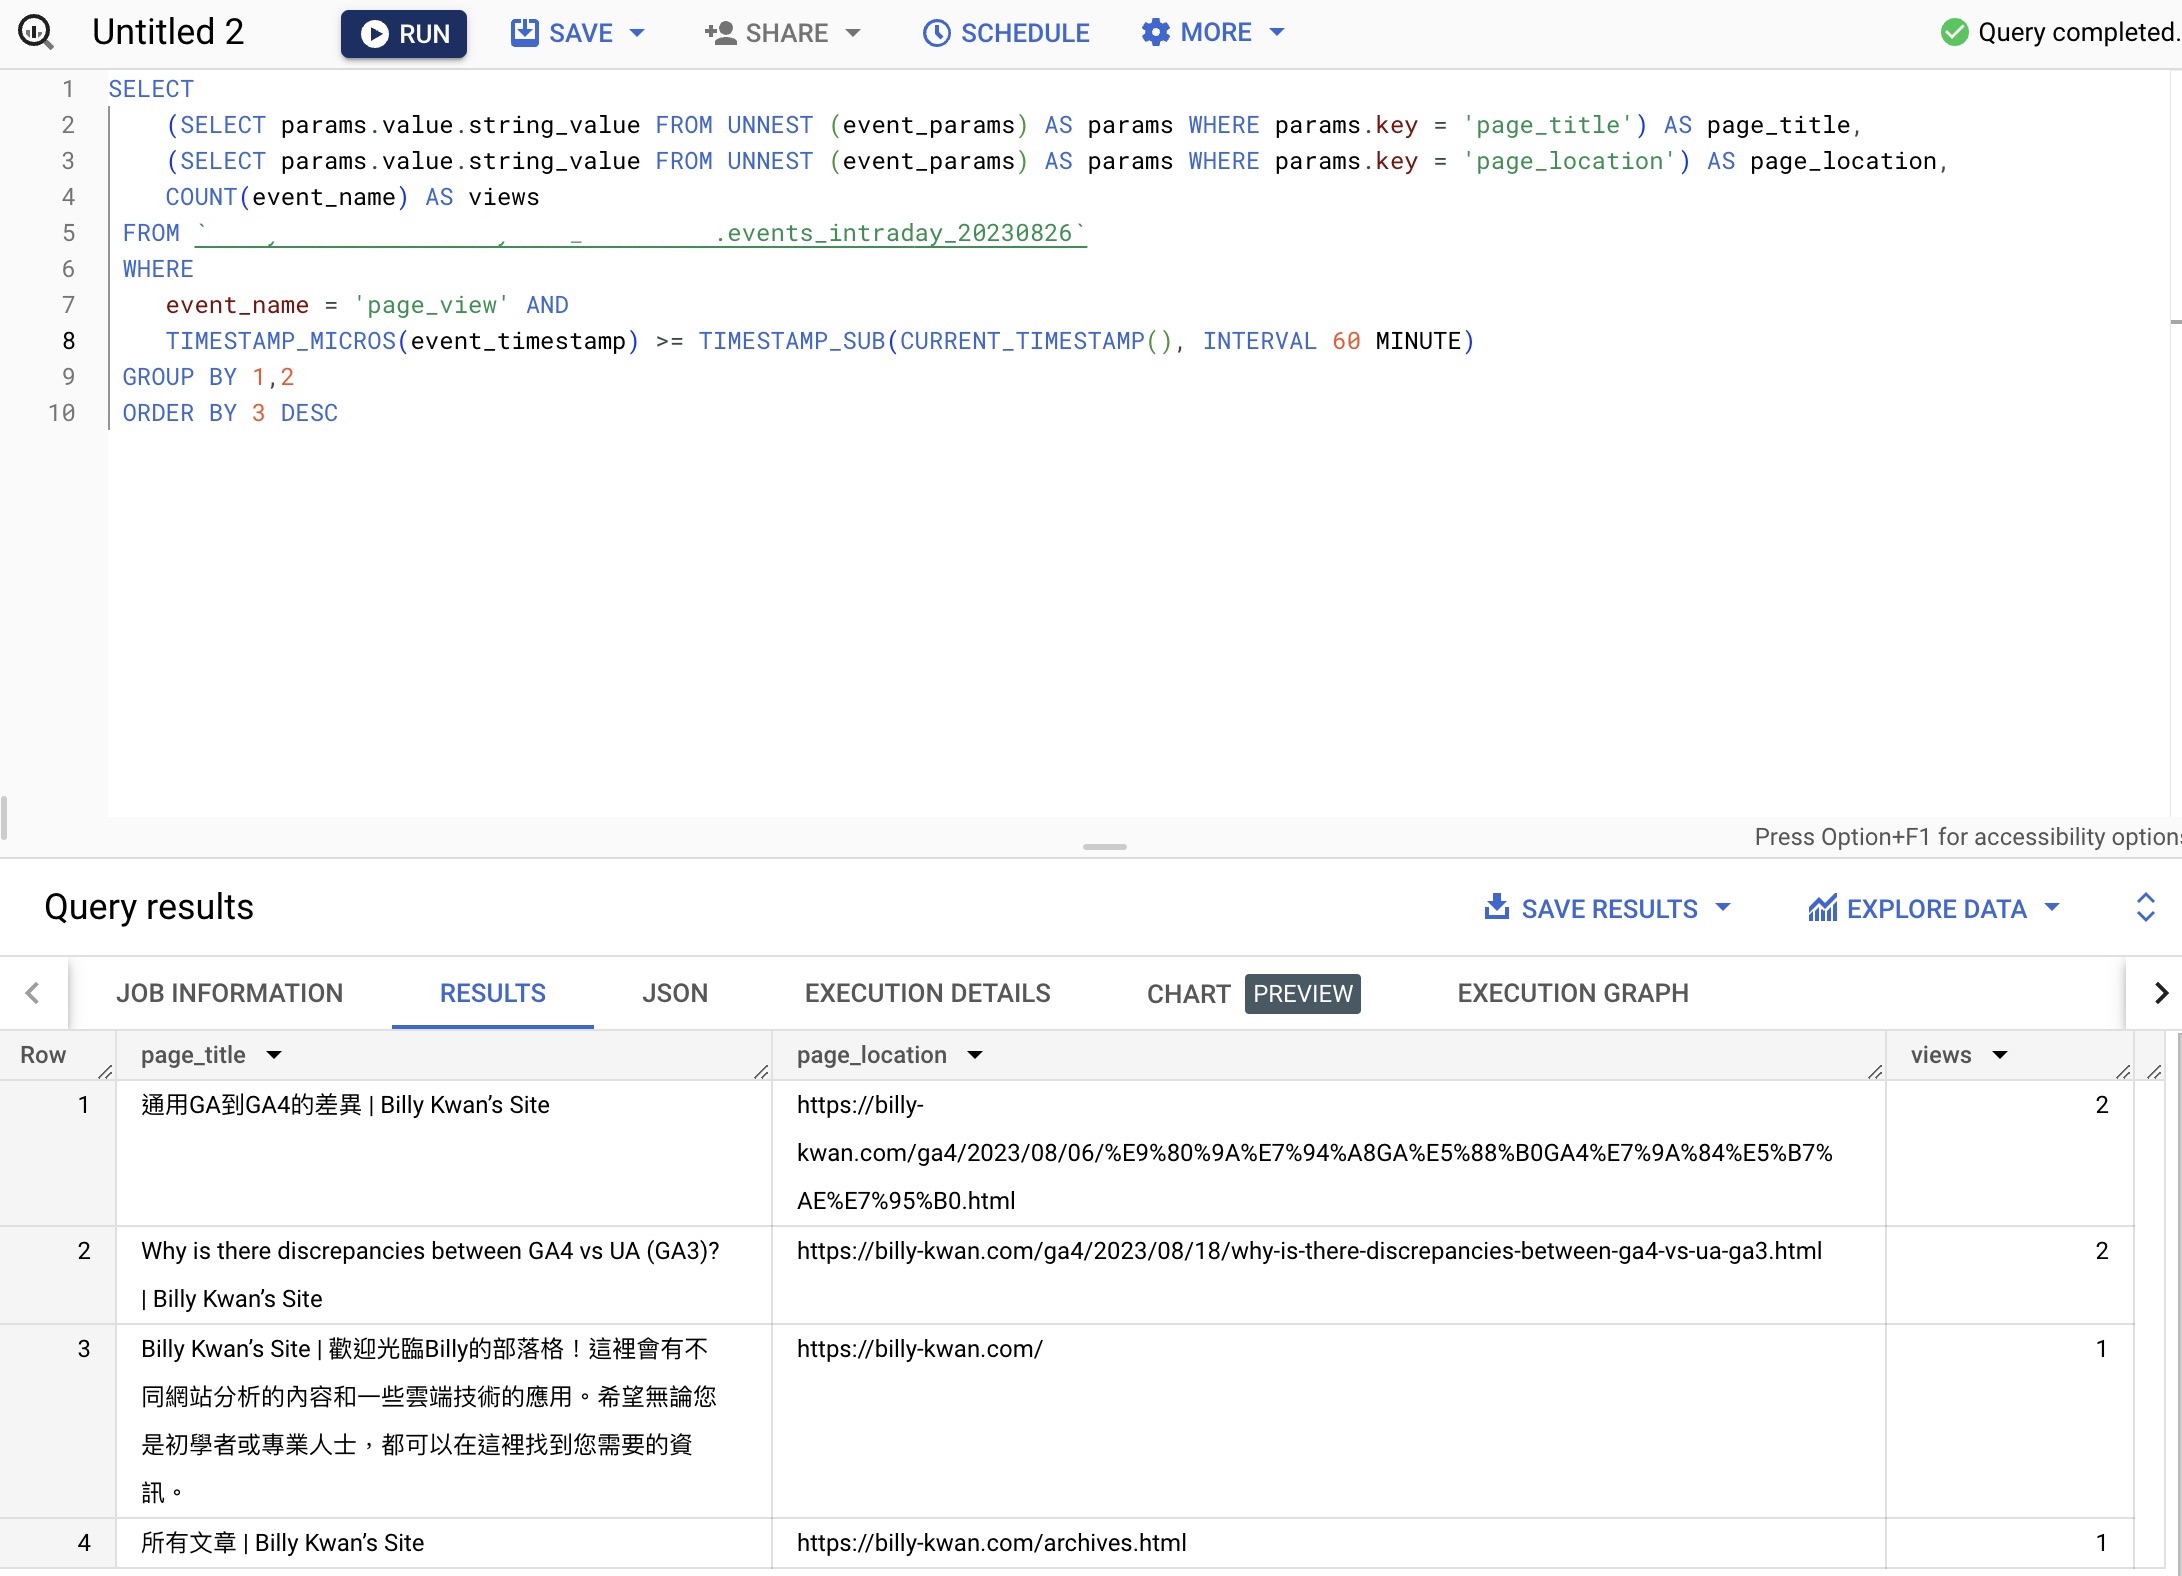
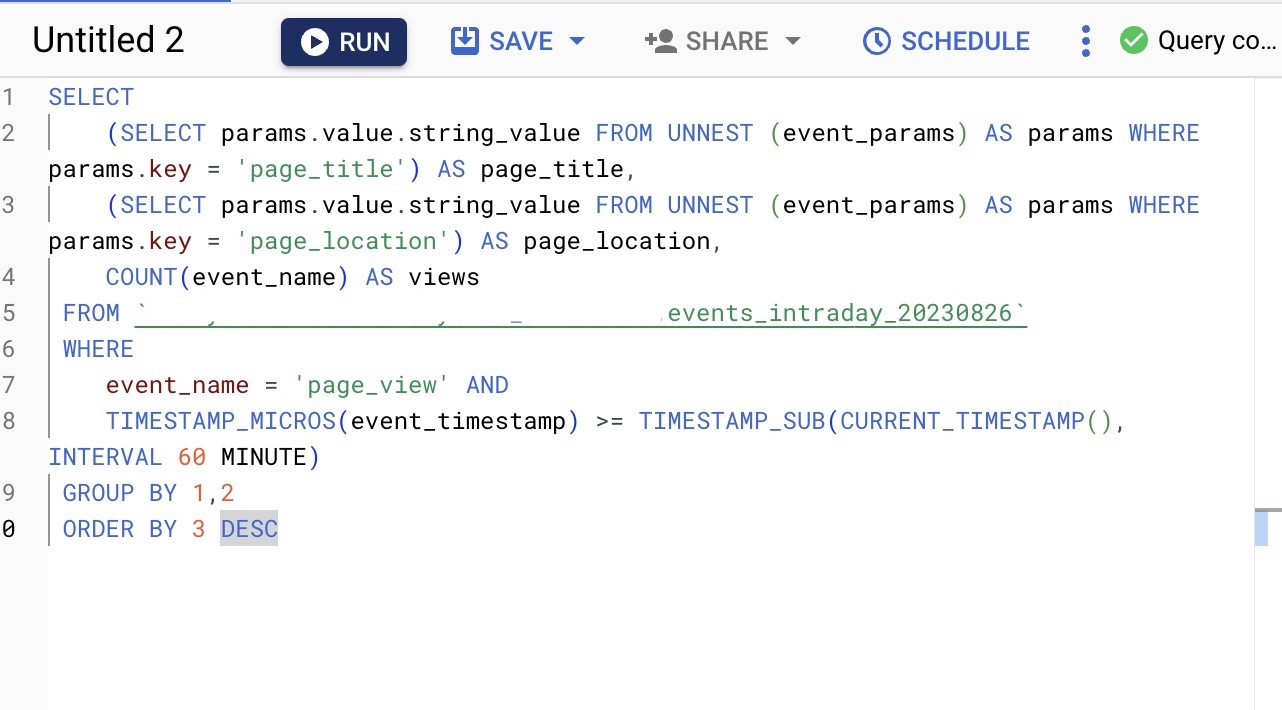
Here’s the sample query that I used. This is a simple query that calcualte the page title & page location and sort by number of view, including data only from past 60 mins.
SELECT
    (SELECT params.value.string_value FROM UNNEST (event_params) AS params WHERE params.key = 'page_title') AS page_title,
    (SELECT params.value.string_value FROM UNNEST (event_params) AS params WHERE params.key = 'page_location') AS page_location,
    COUNT(event_name) AS views
FROM `billykwan-32764.analytics_396878722.events_intraday_20230826`
WHERE
    event_name = 'page_view' AND
    TIMESTAMP_MICROS(event_timestamp) >= TIMESTAMP_SUB(CURRENT_TIMESTAMP(), INTERVAL 60 MINUTE)
GROUP BY 1,2
ORDER BY 3 DESC
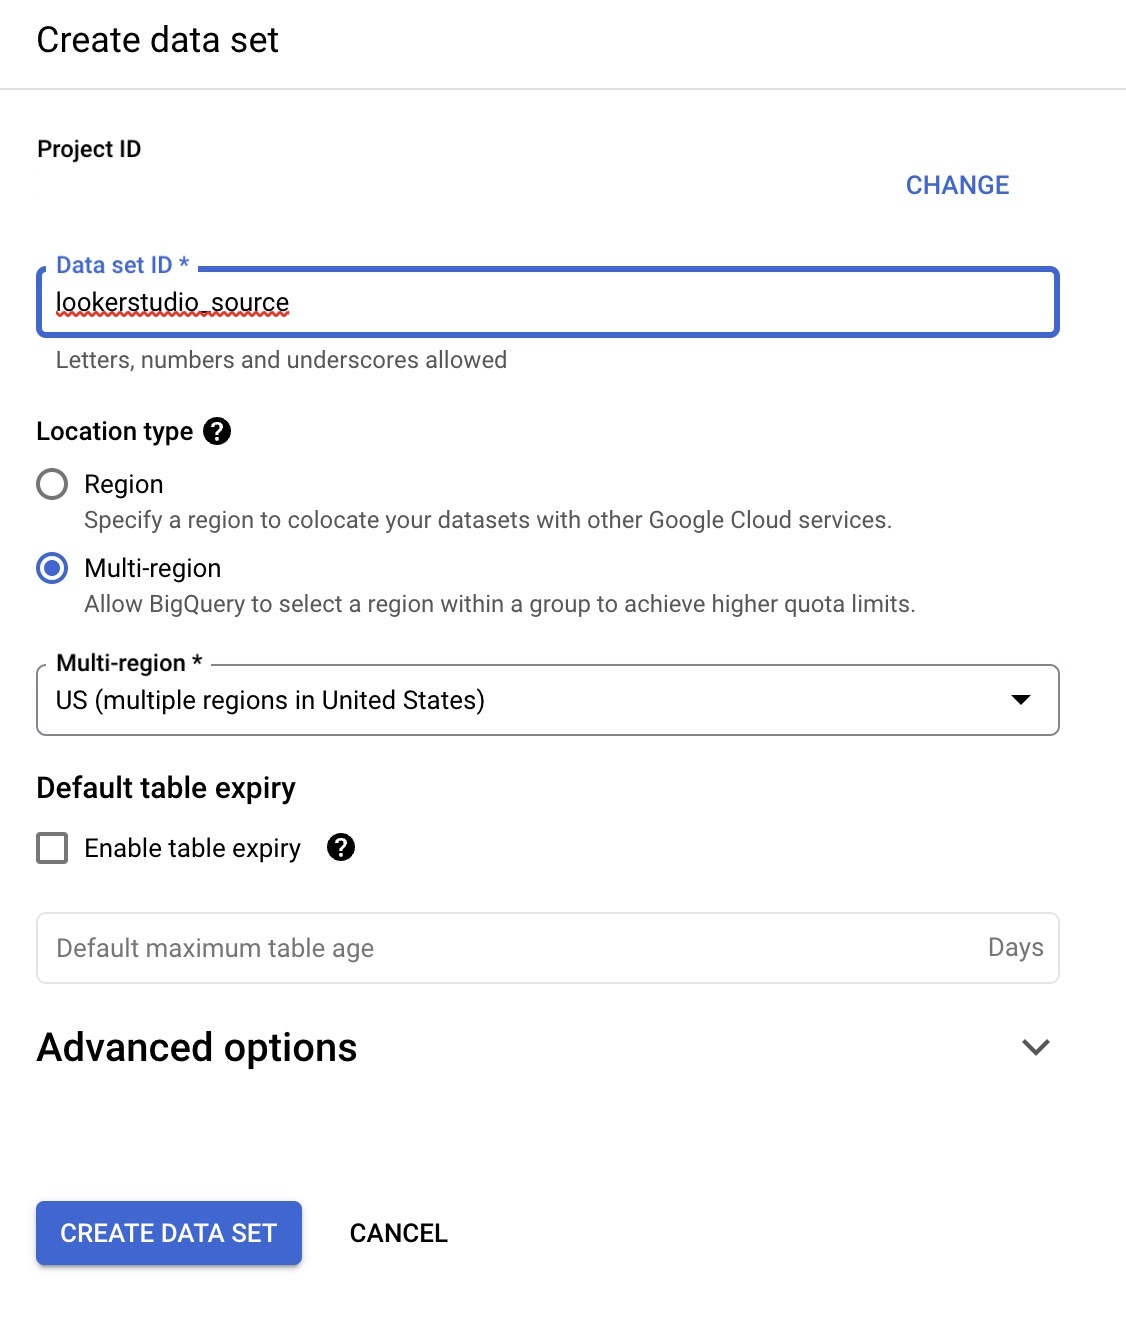
Step4: Create a dataset to hold your real time data.
I created a dataset call lookerstudio_source. This will be used to host all real time table that I need. Couples setup to be mindful of
- no space for the datasetname
- make sure the data you stored is in the same region, usually keeping it at multi-region, US is fine.
Then hit create data set button
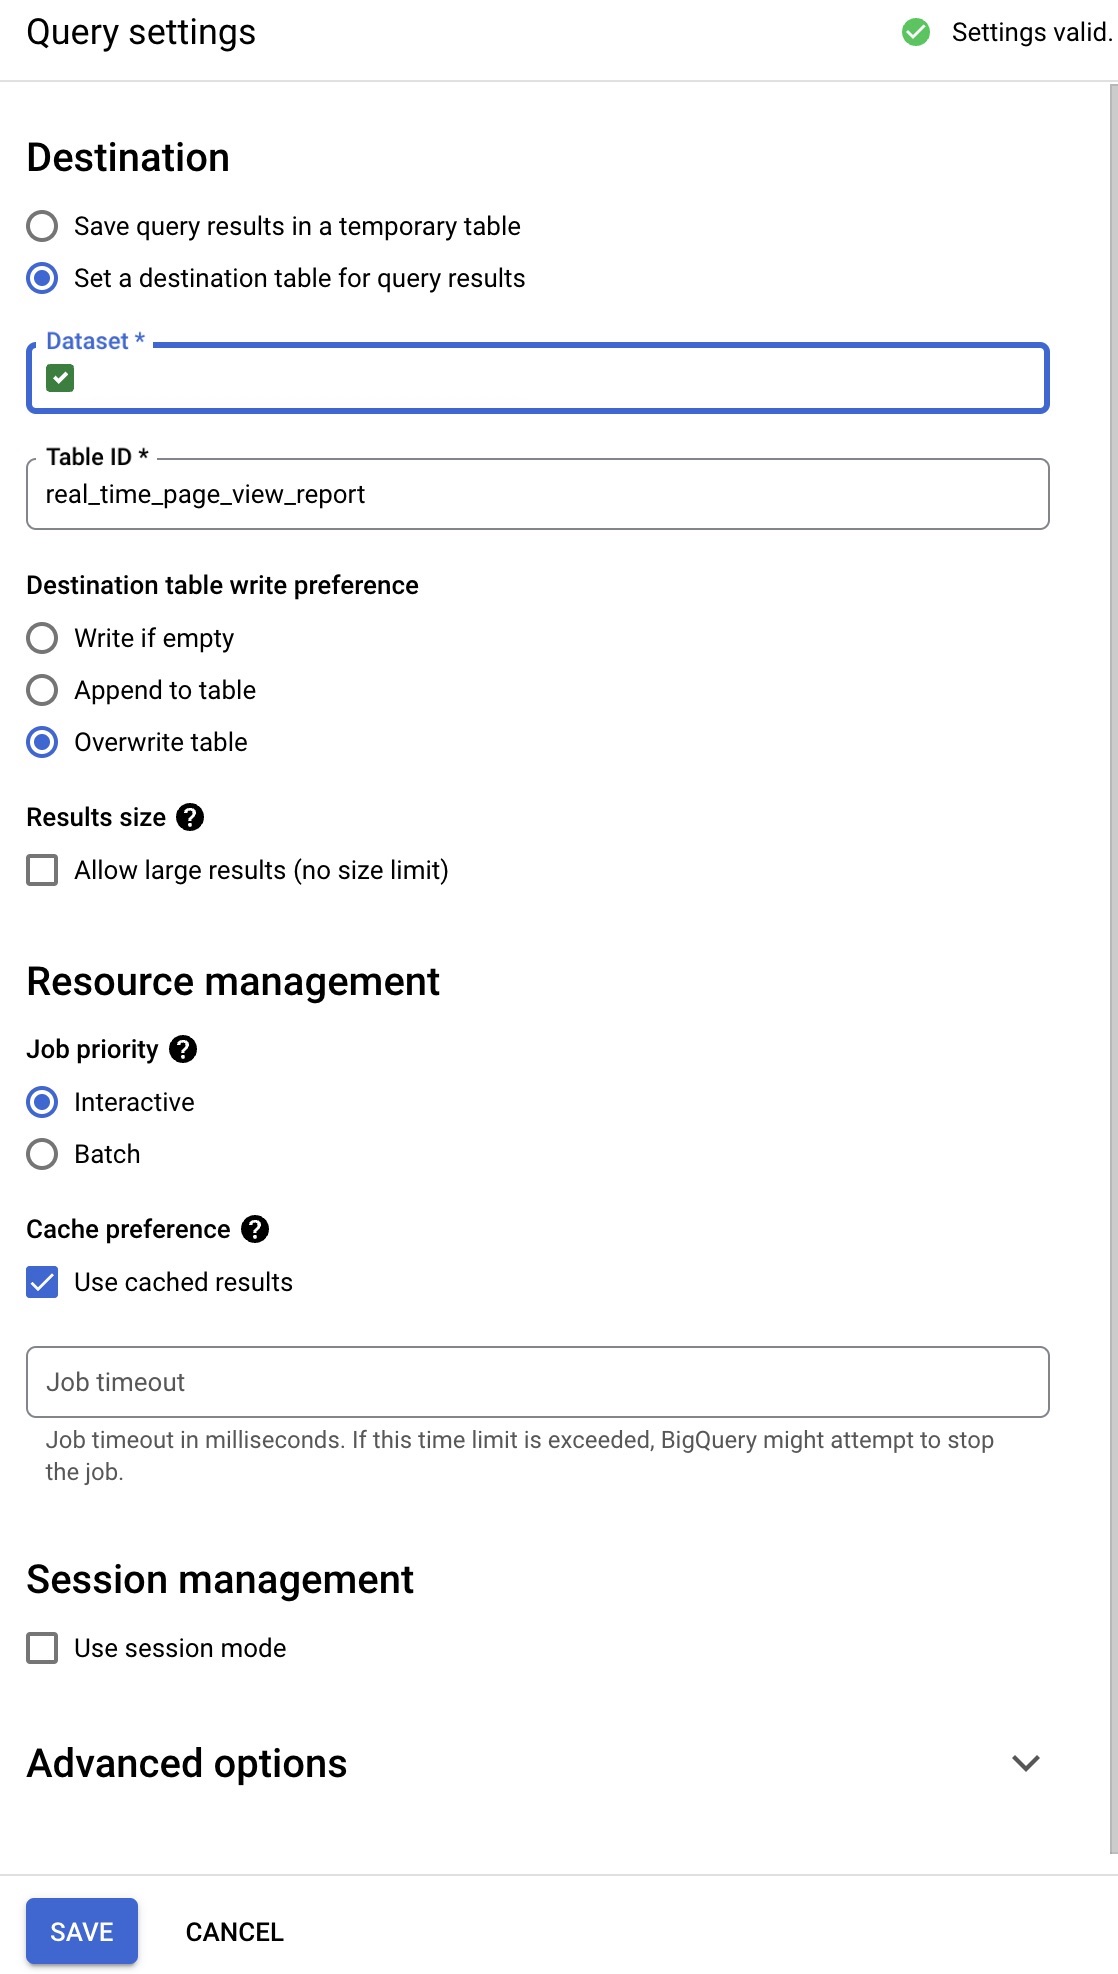
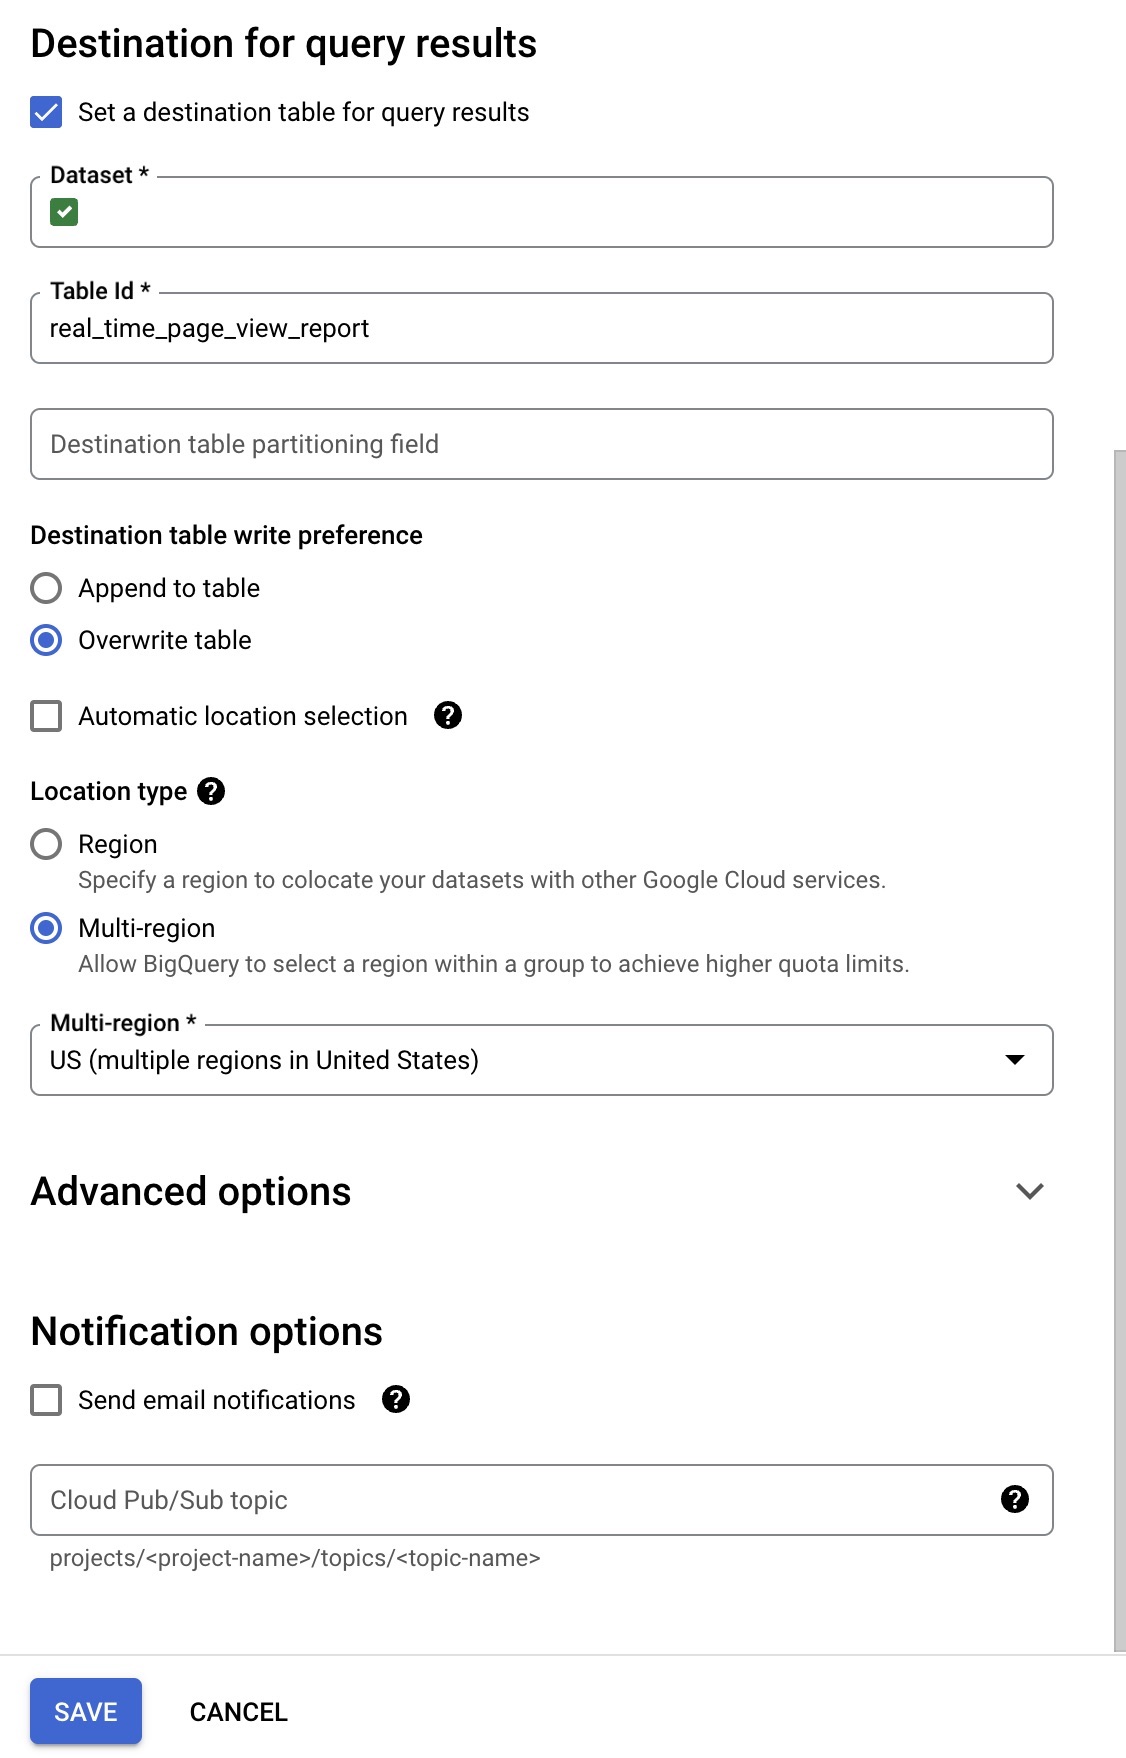
Step5: Modify query setting
In your panel, go to MORE » query setting. Then udpate your query setting as below.
- set a destination table for query result
- set the right dataset, in this case, lookerstudio_source
- overwrite table
The rest you can leave it as it is, then click save.
Step6: Schedule your query to run regularly.
In your panel, click schedule
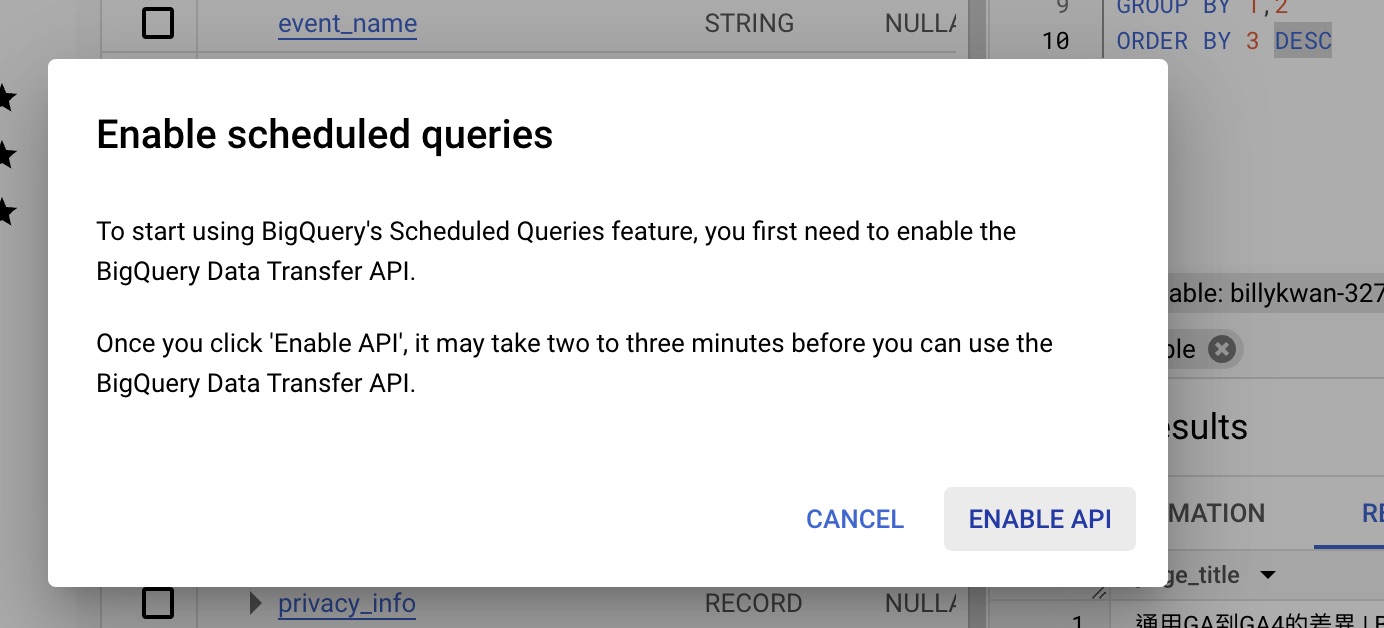
Step7: Enable schedule job API
click enable API
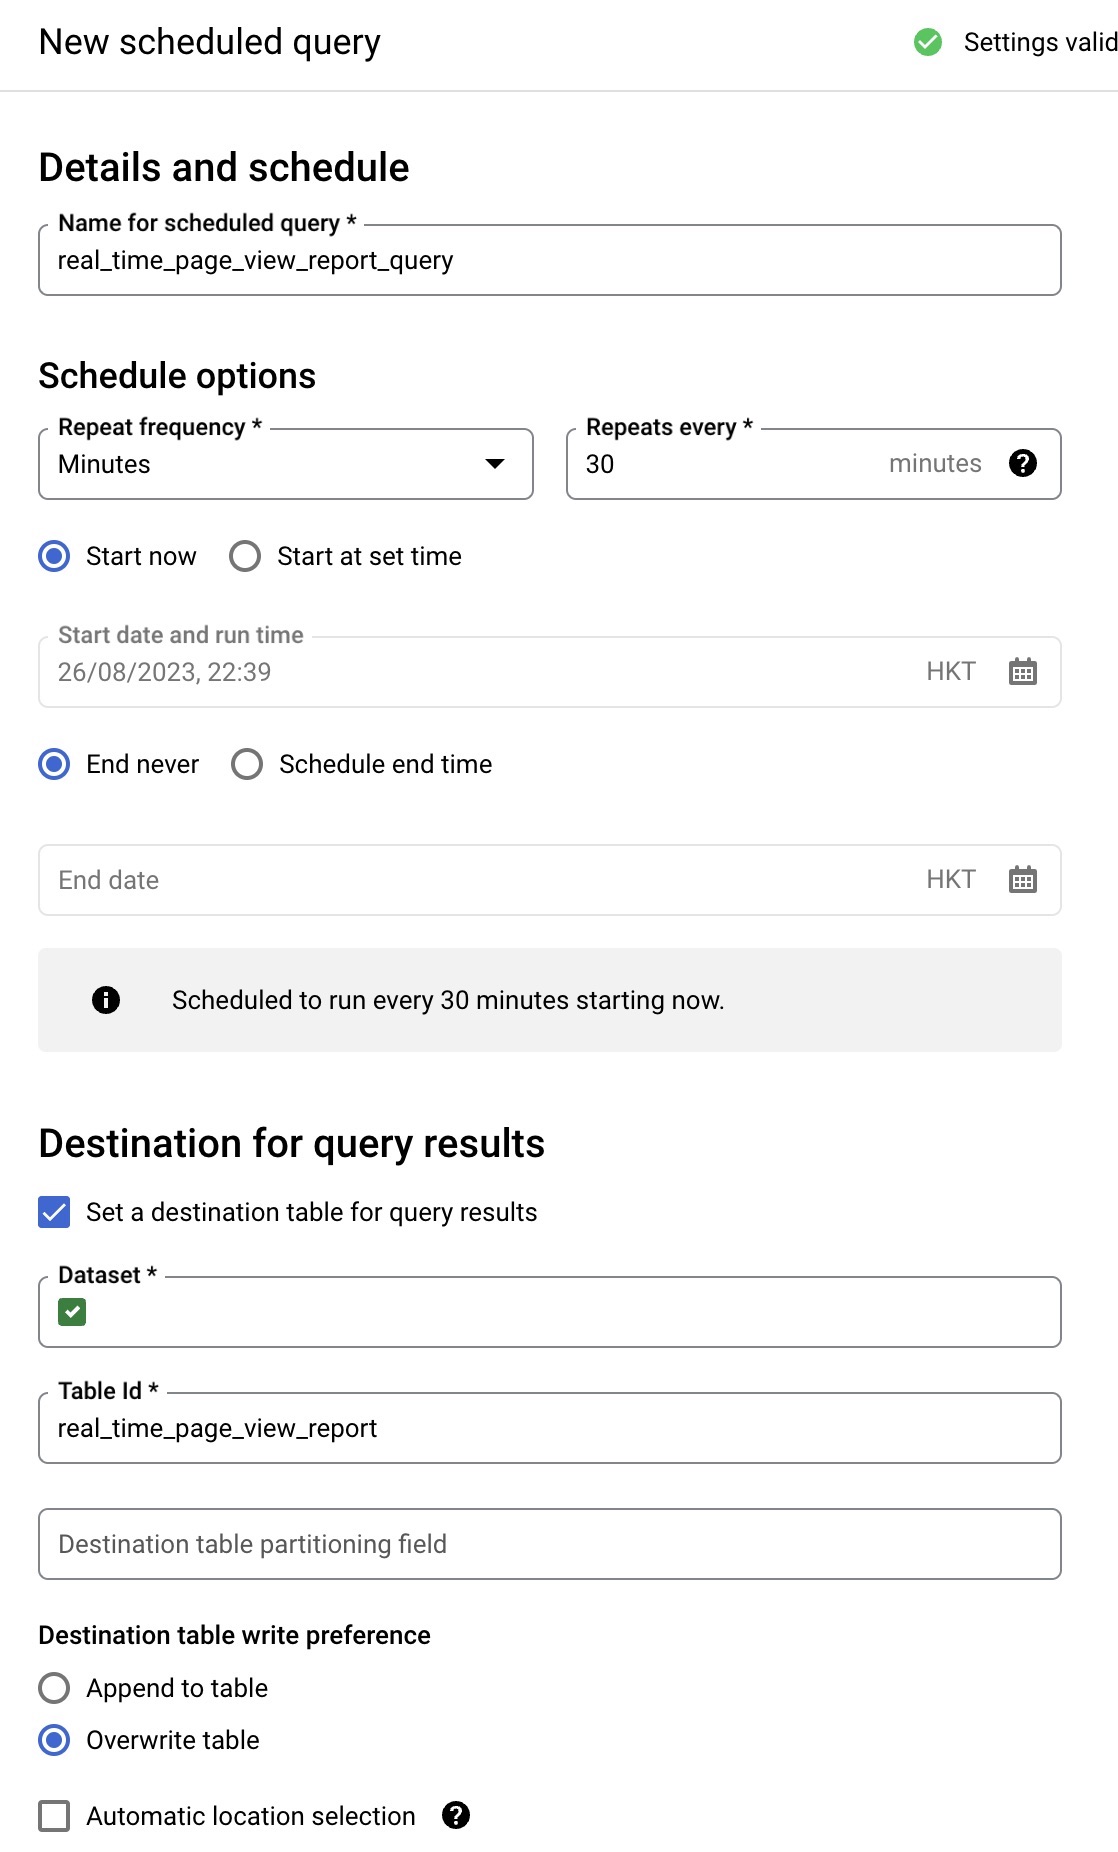
Step8: Update the details of your schedule query
Update the schedule query as below.
- give this schedule a name
- update the frequency as you wish, GA4 data, in general streaming data will be available within 15 min, so I would recommend to set no smaller than 15min
- set the destination as lookerstudio_source
- set the table name
- make sure you tick overwrite table
- choose it as multi-region
After you finished the setup, click save and it will run automatically!
Configuration in Looker Studio
Setting up visualisation in Looker Studio
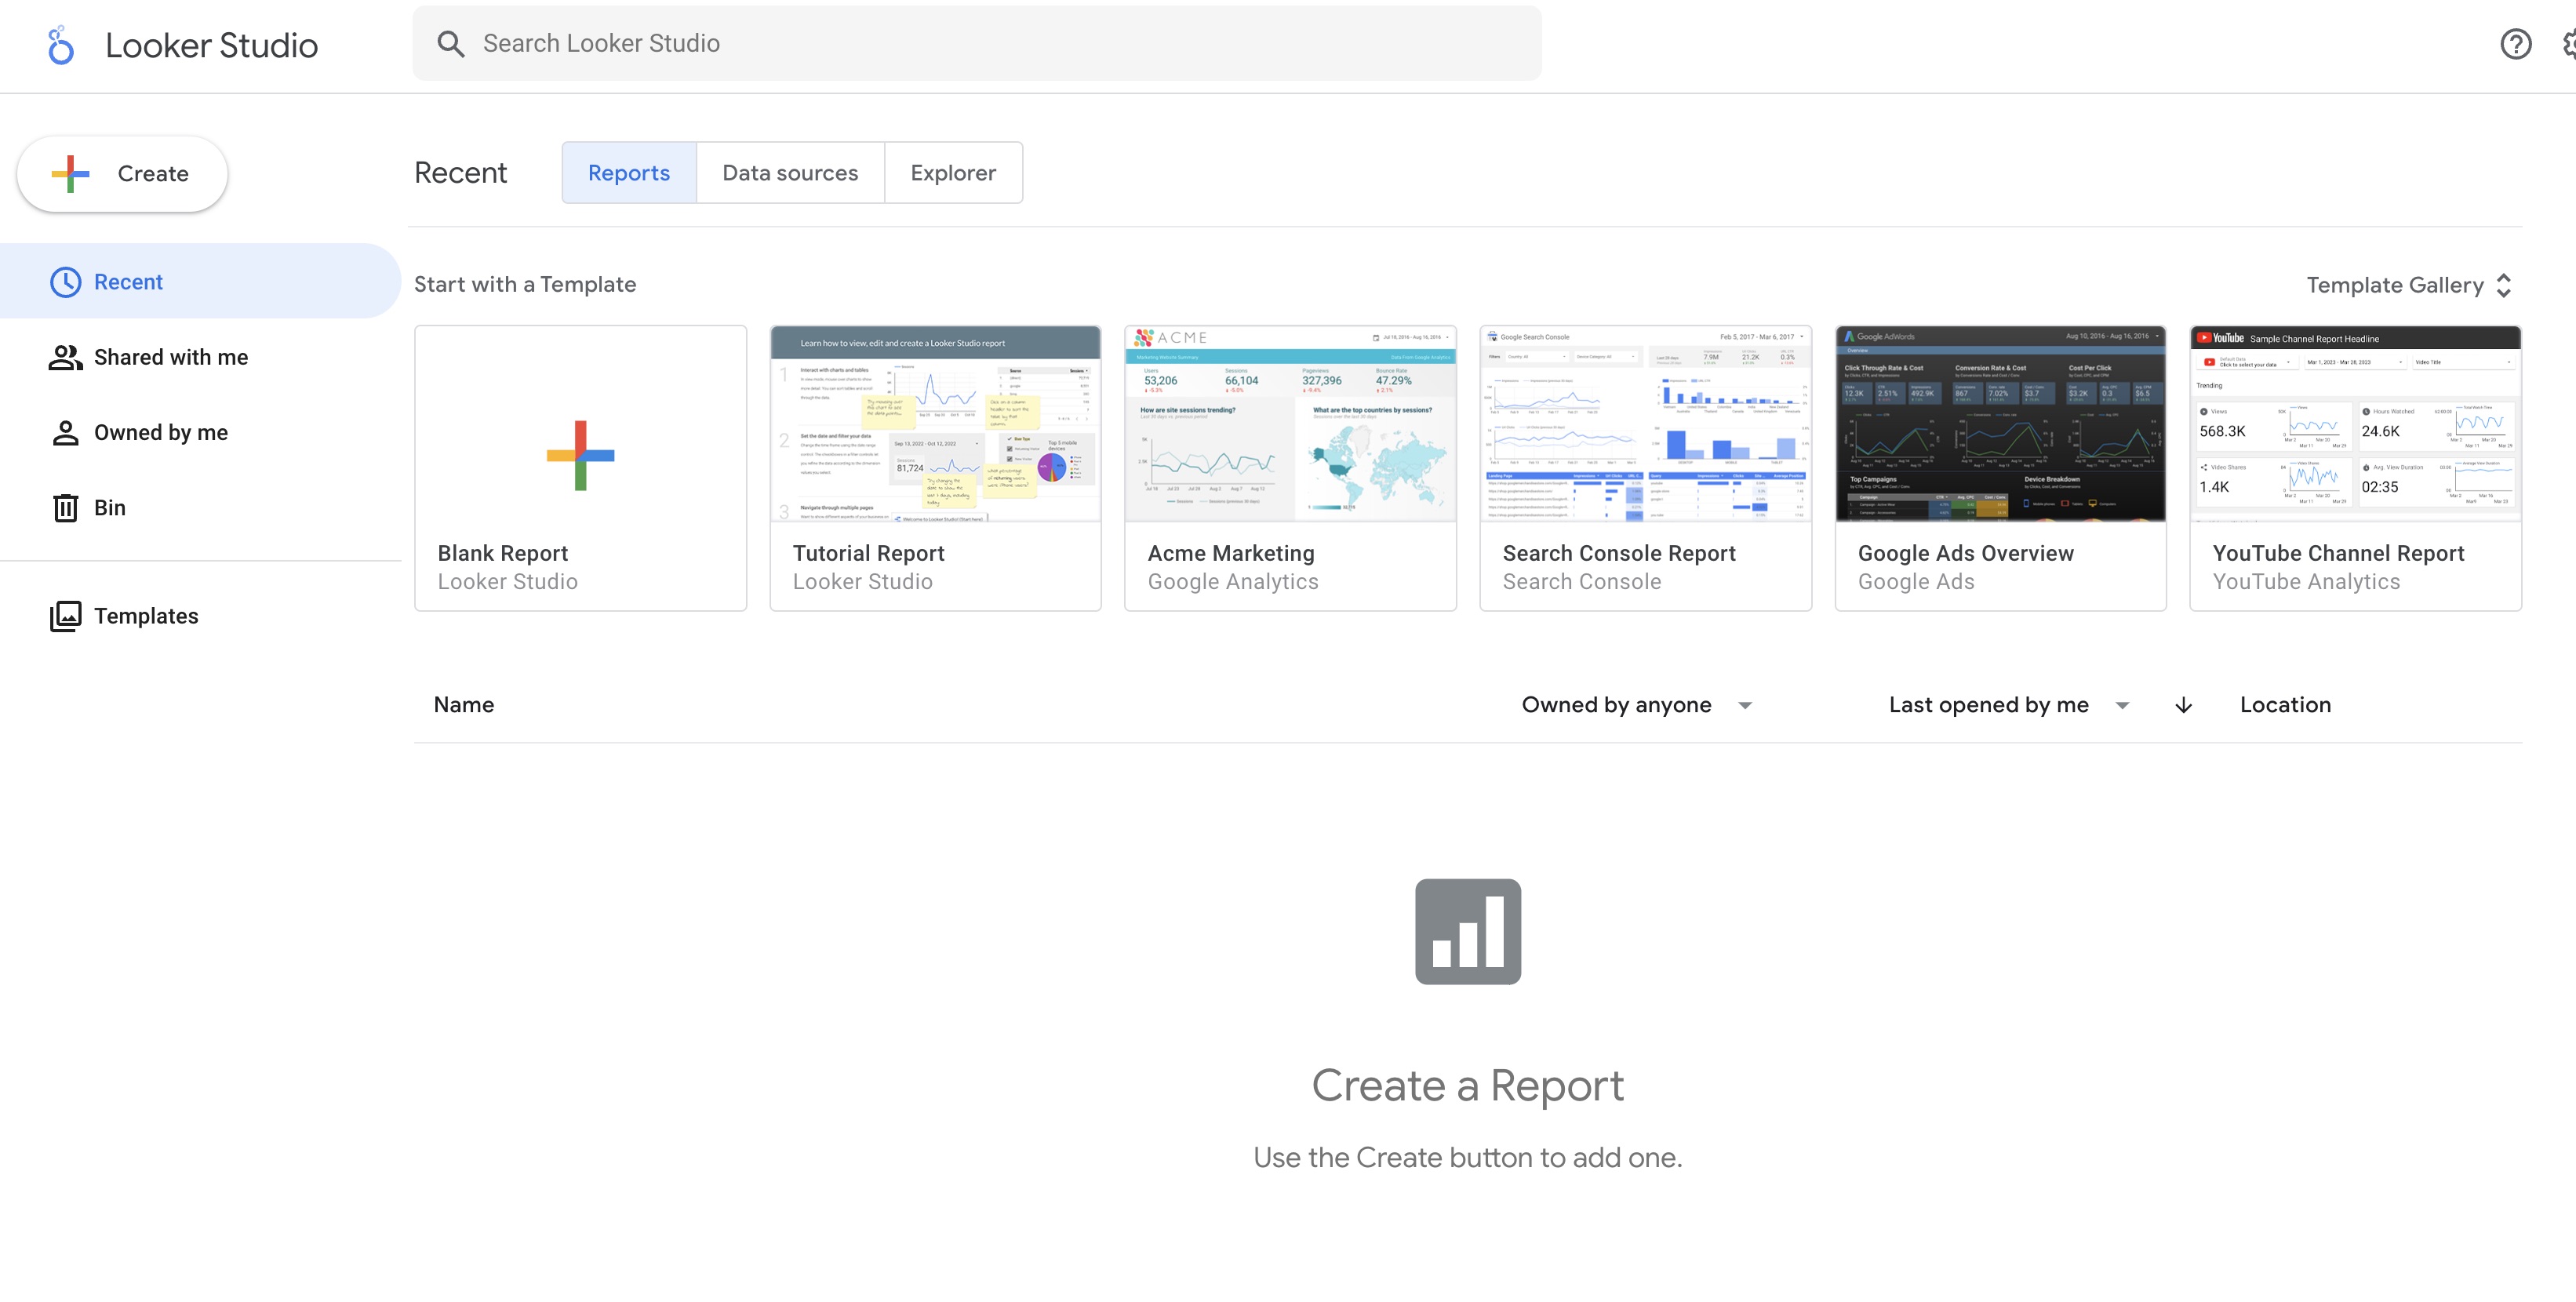
Step9: Create your dashboard using looker studio
Go to Looker Studio to create your own dashboard.
click to add a blank report.
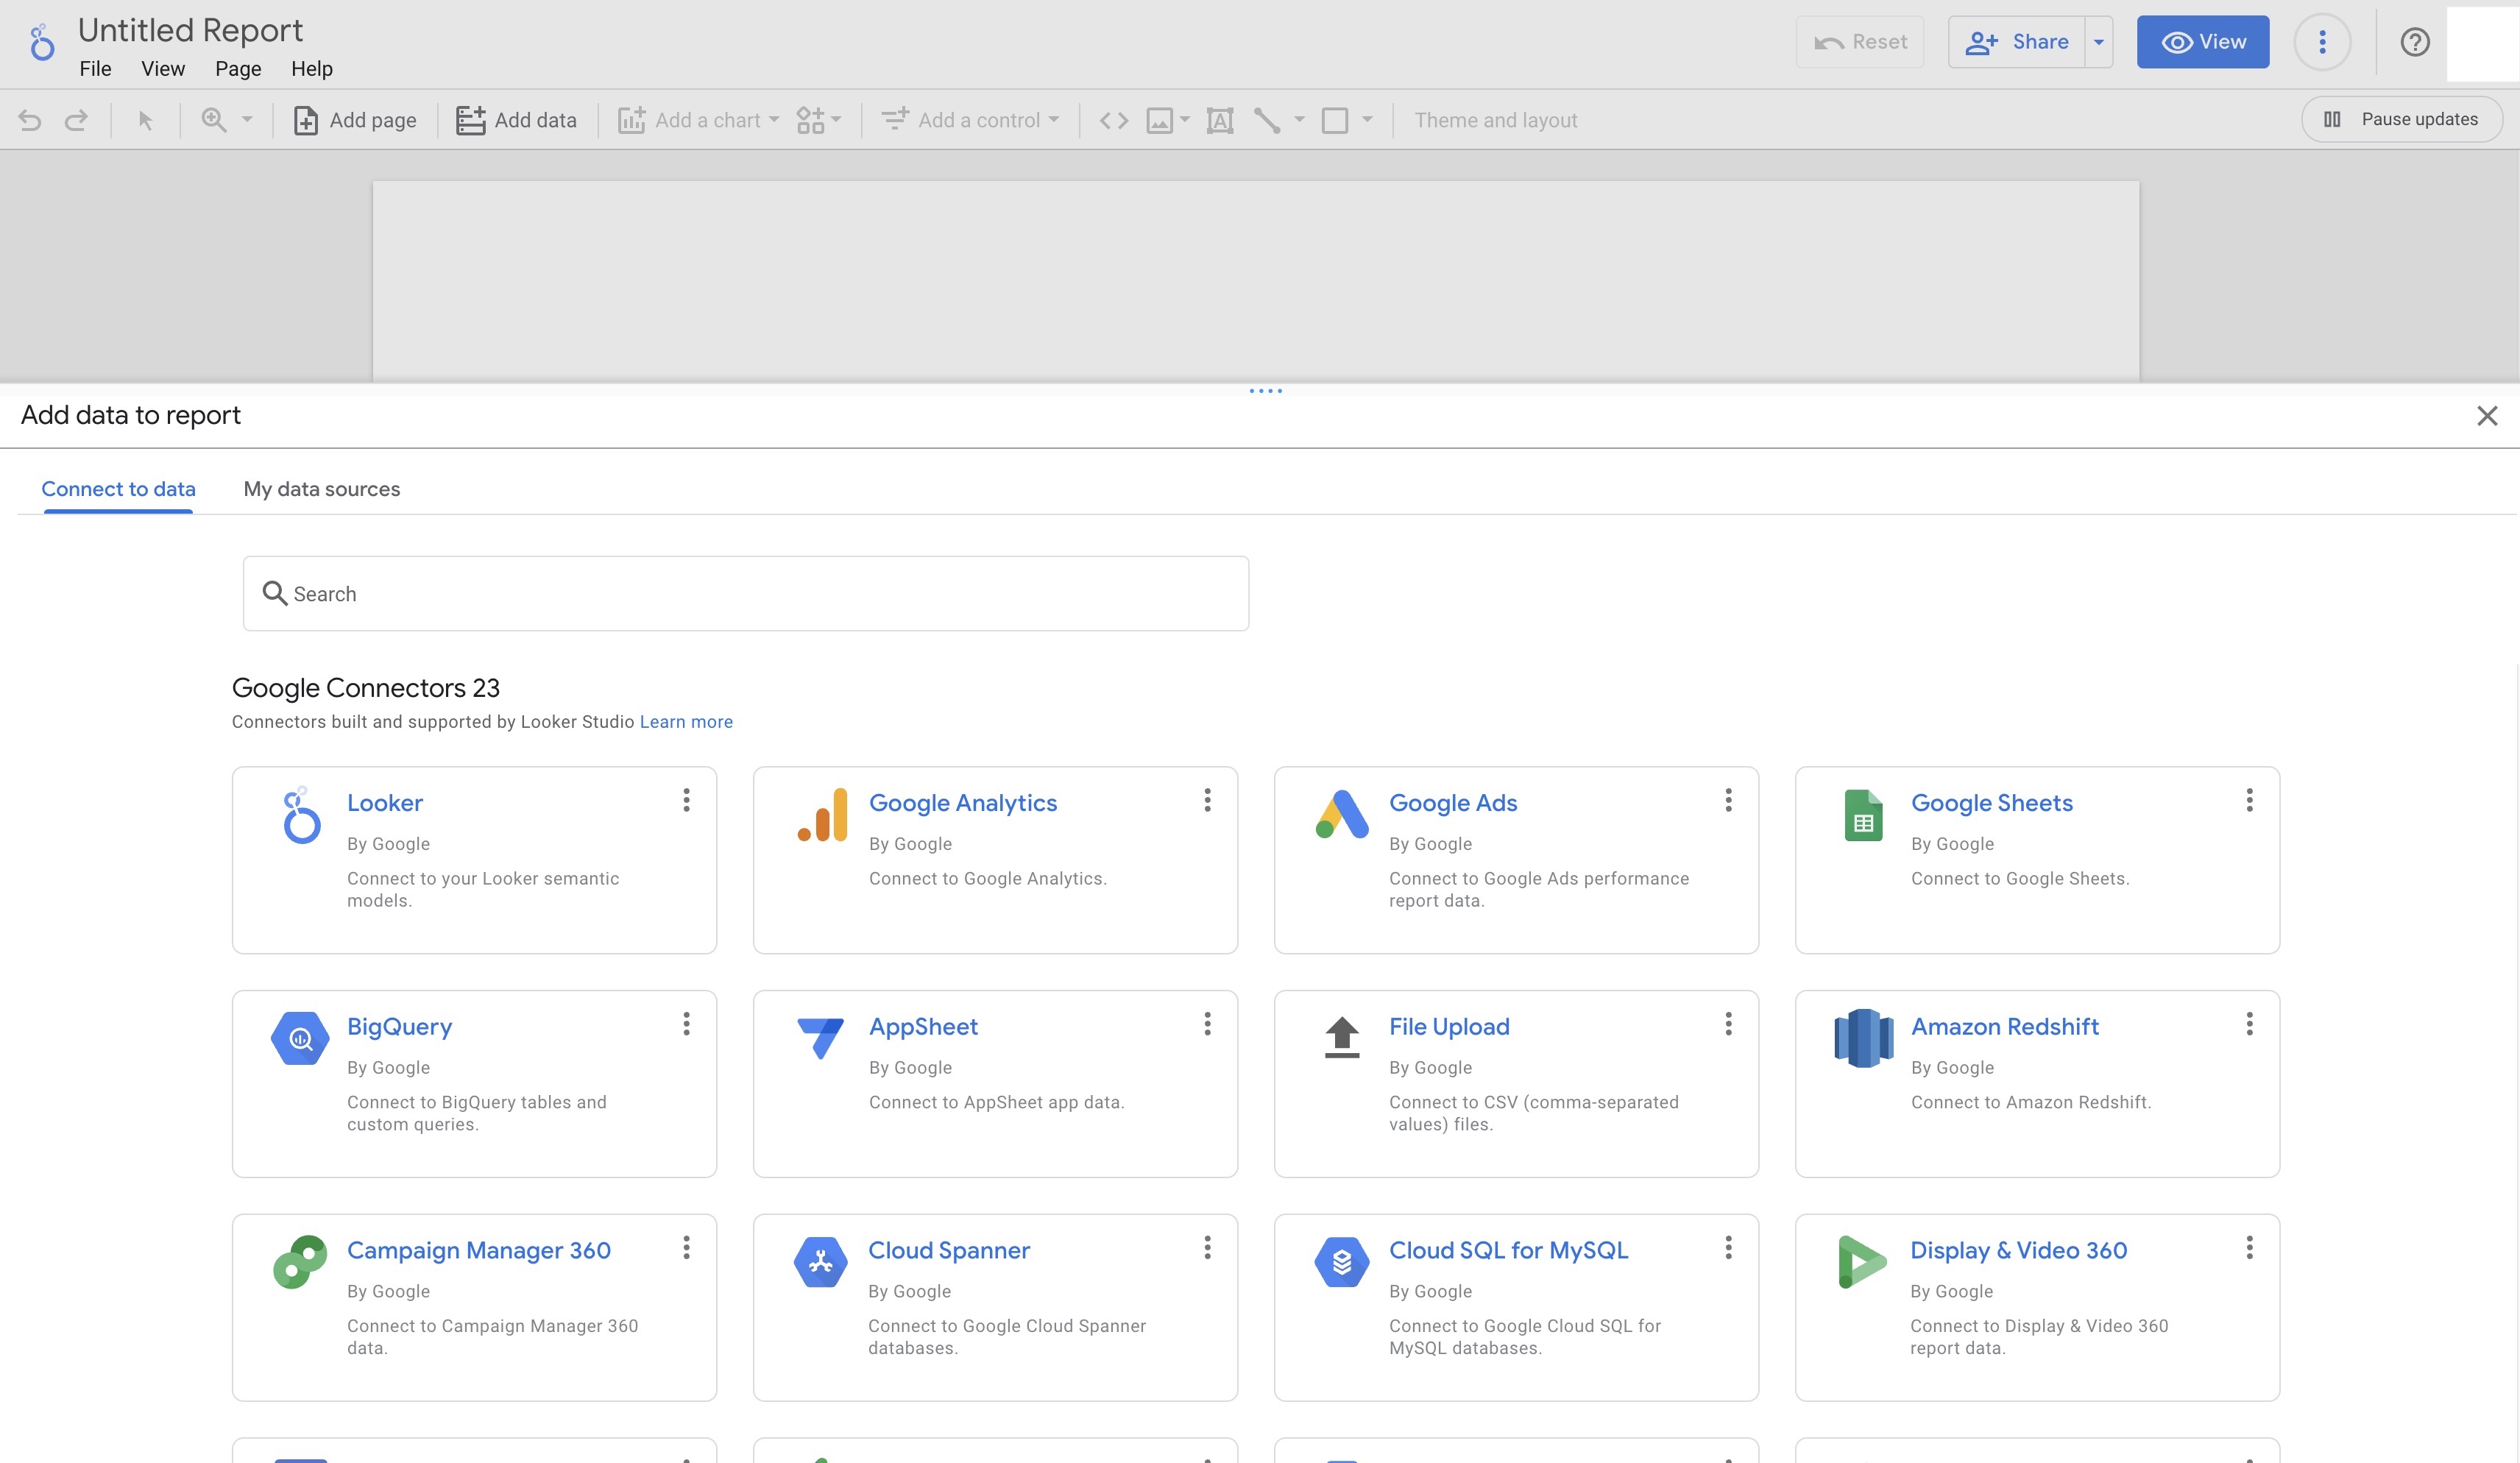
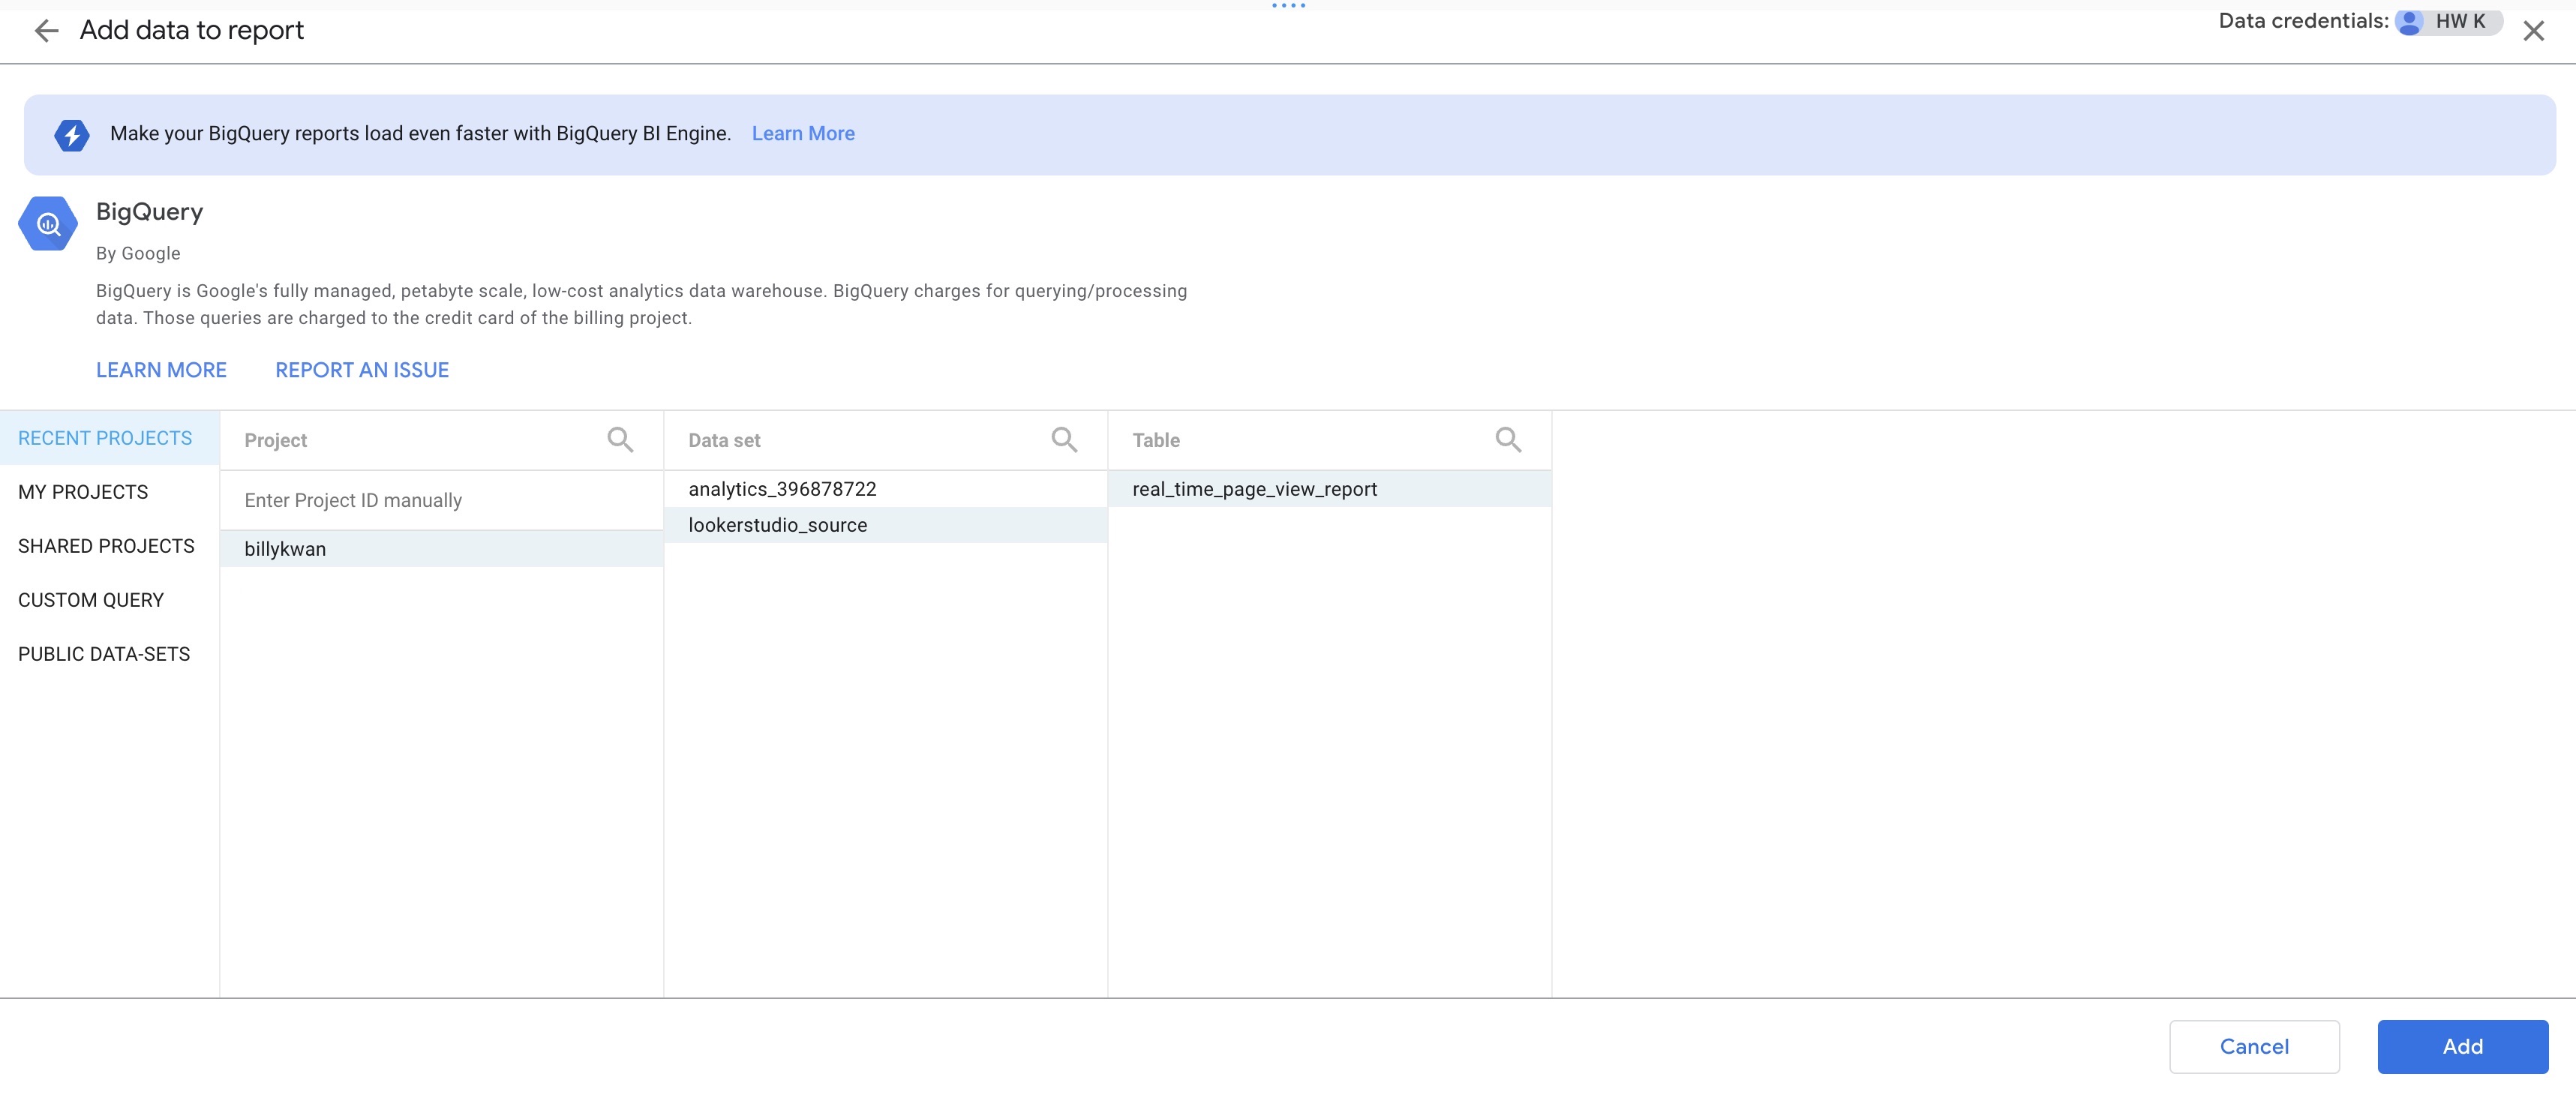
Step10: Create a BigQuery data source in Looker Studio
Add BigQuery as a data source in your looker studio.
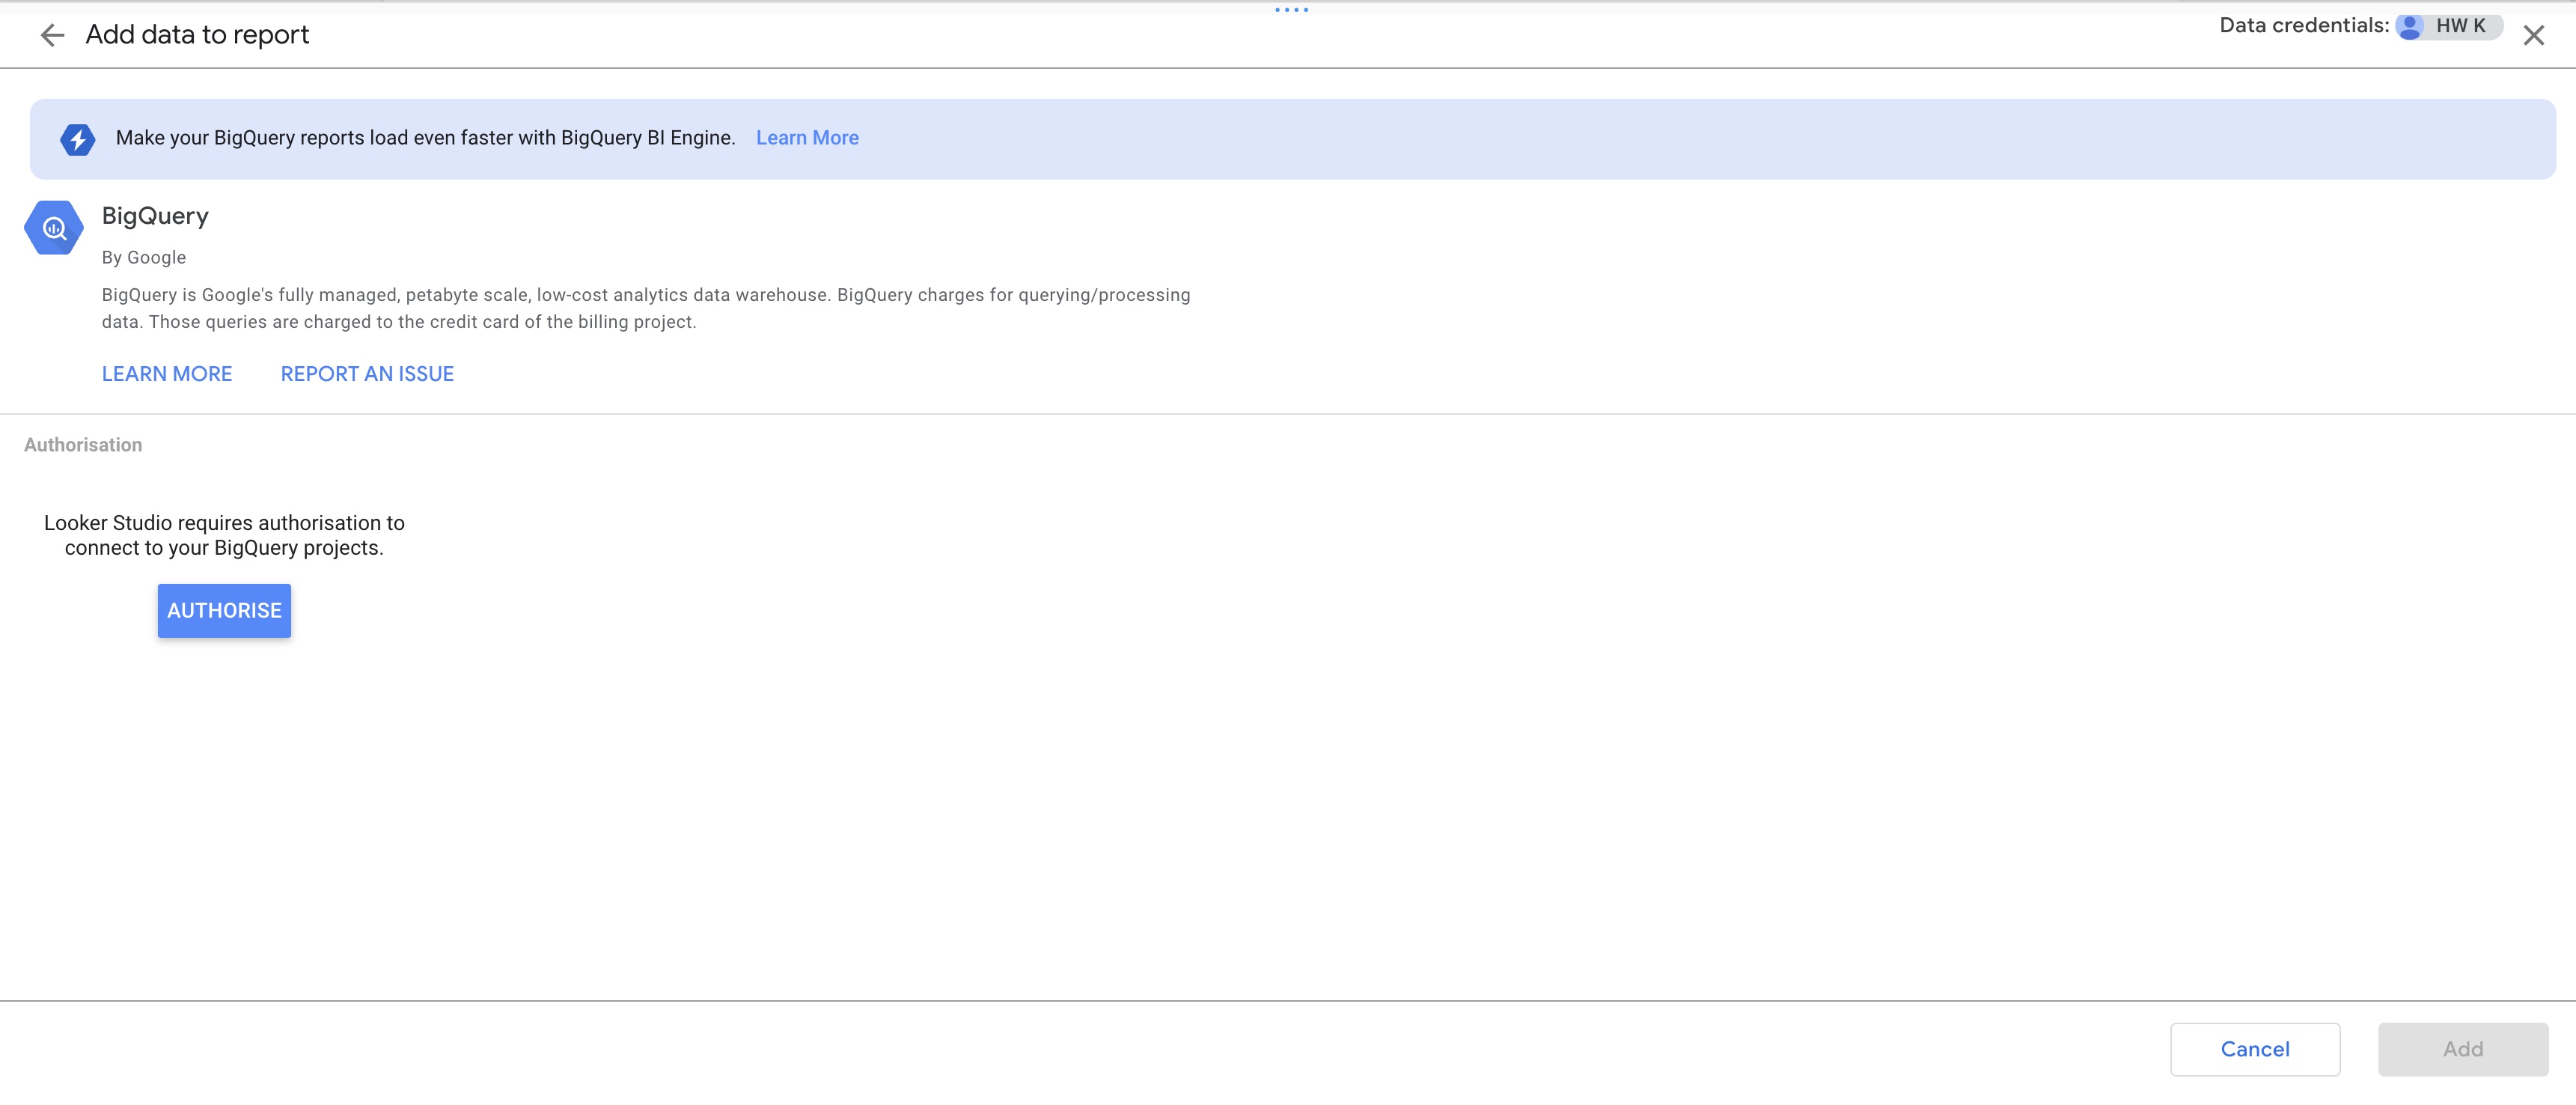
Step11: Enable BigQuery API
Enable the API for pulling BigQuery data
Step12: Select the table created
Select the table we have just created.
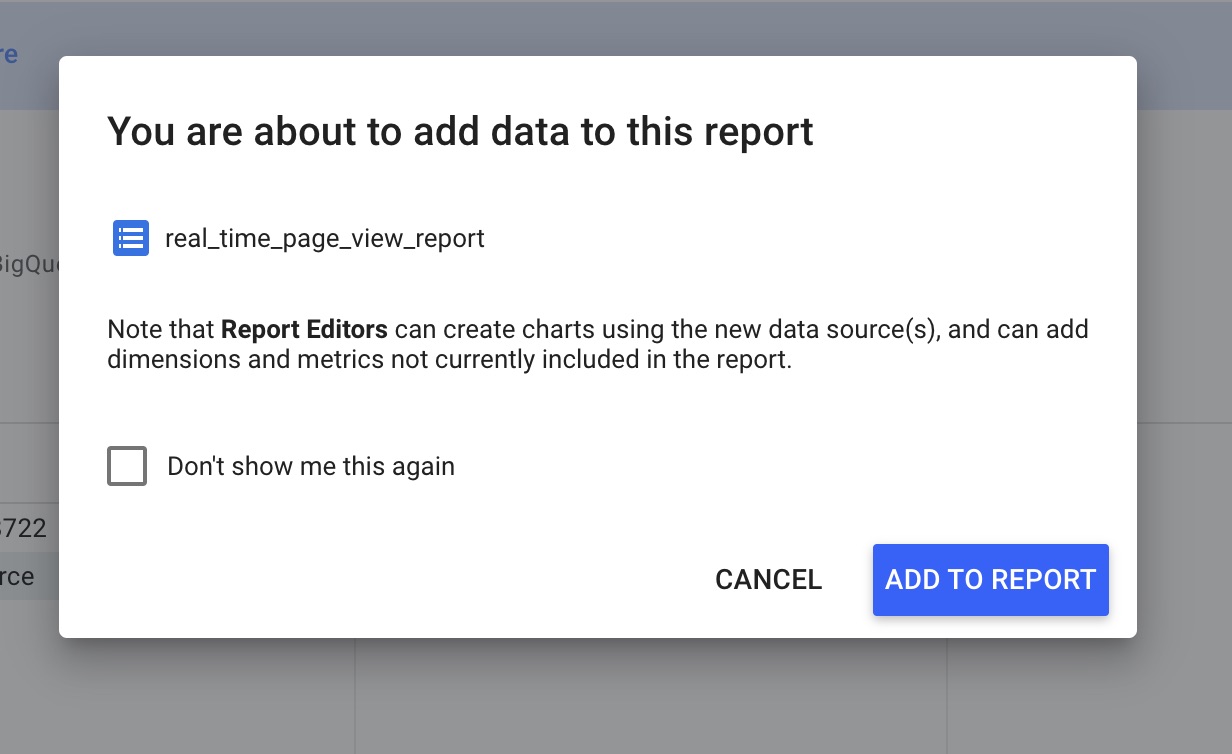
Step13: Add the data source into report
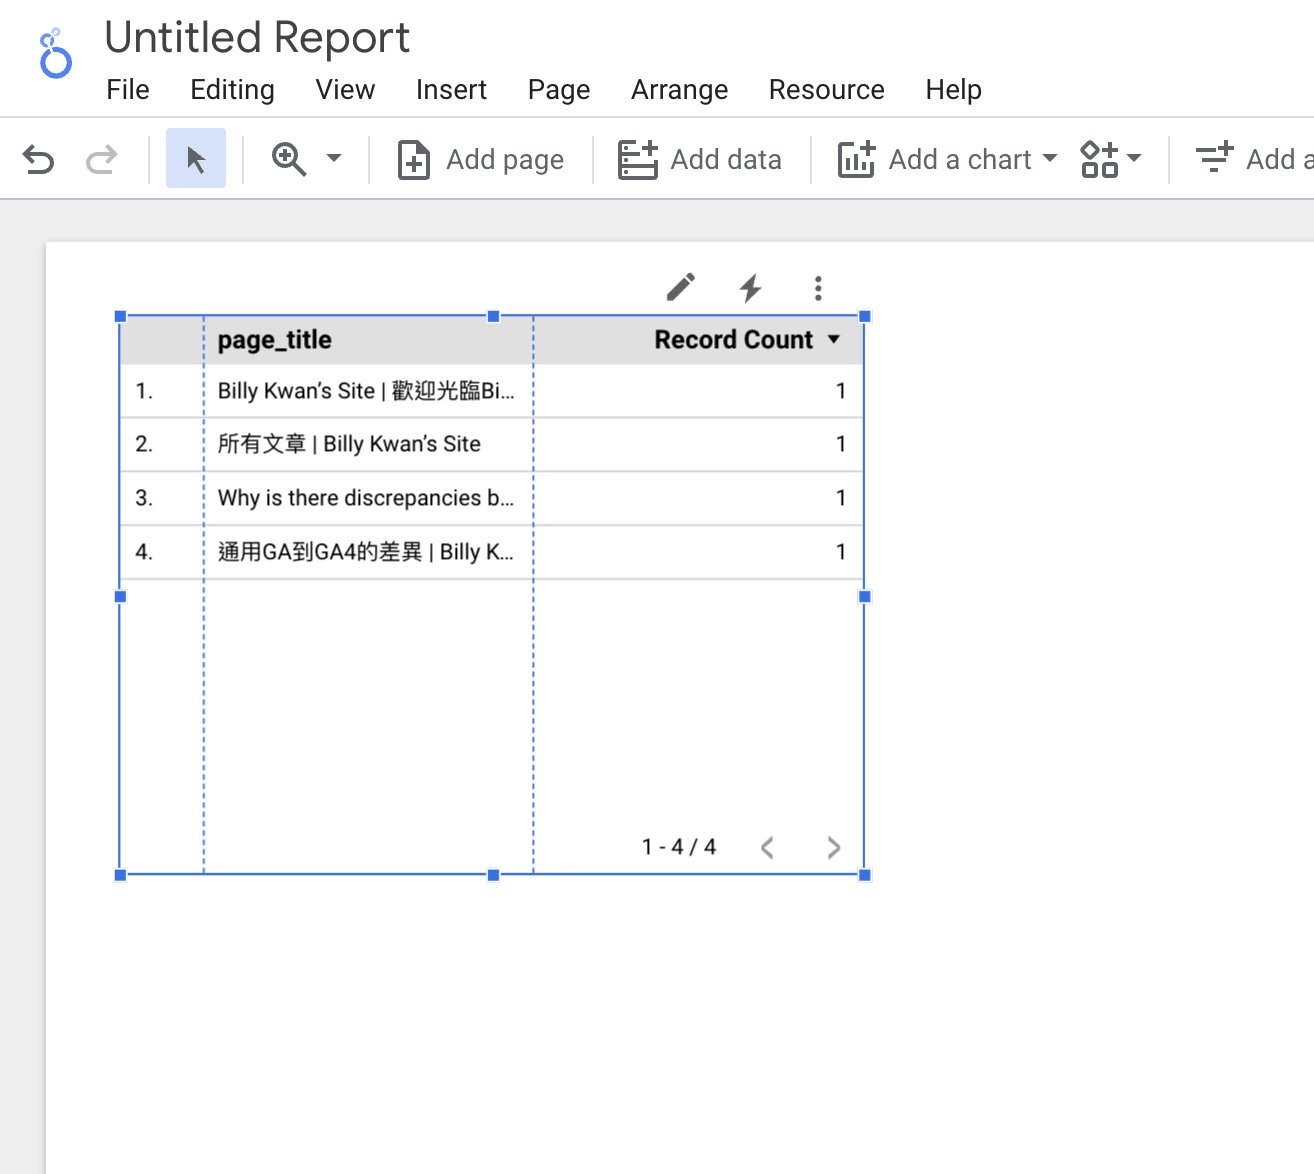
Step14: Check the report
There you go! now you have the report
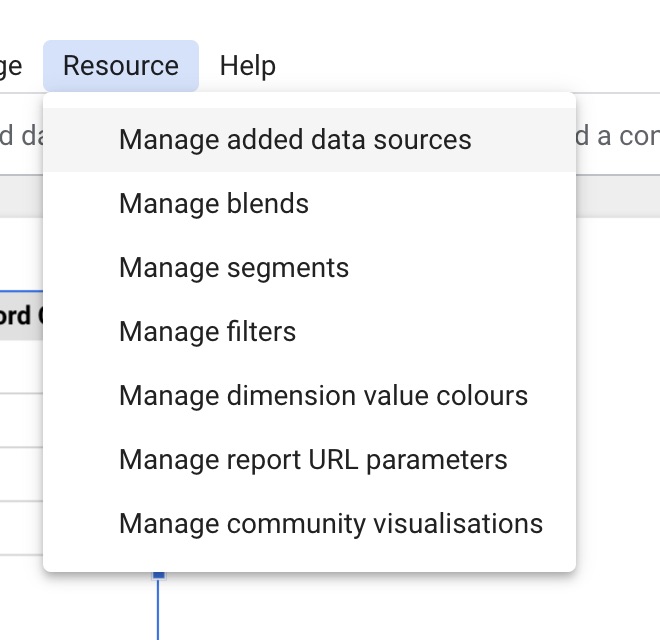
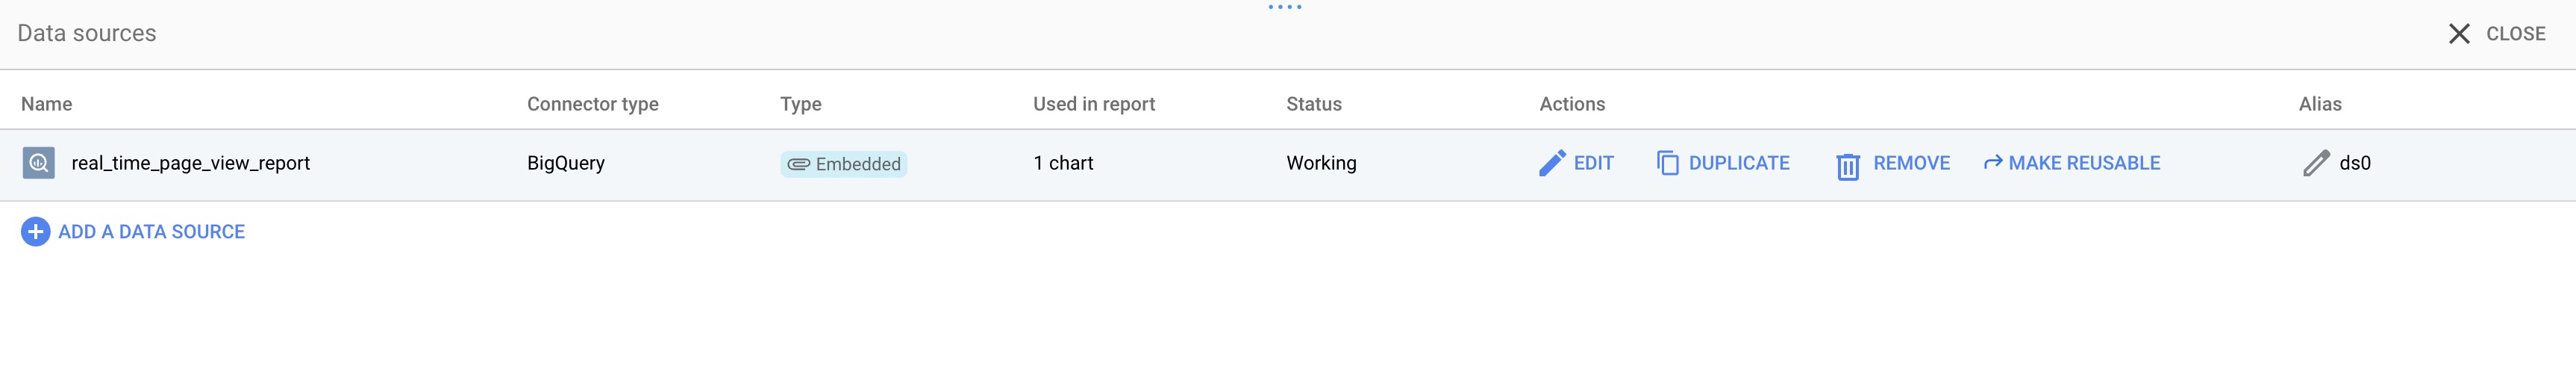
Step15: Go to manage added data source
Go to resource » manage added data source
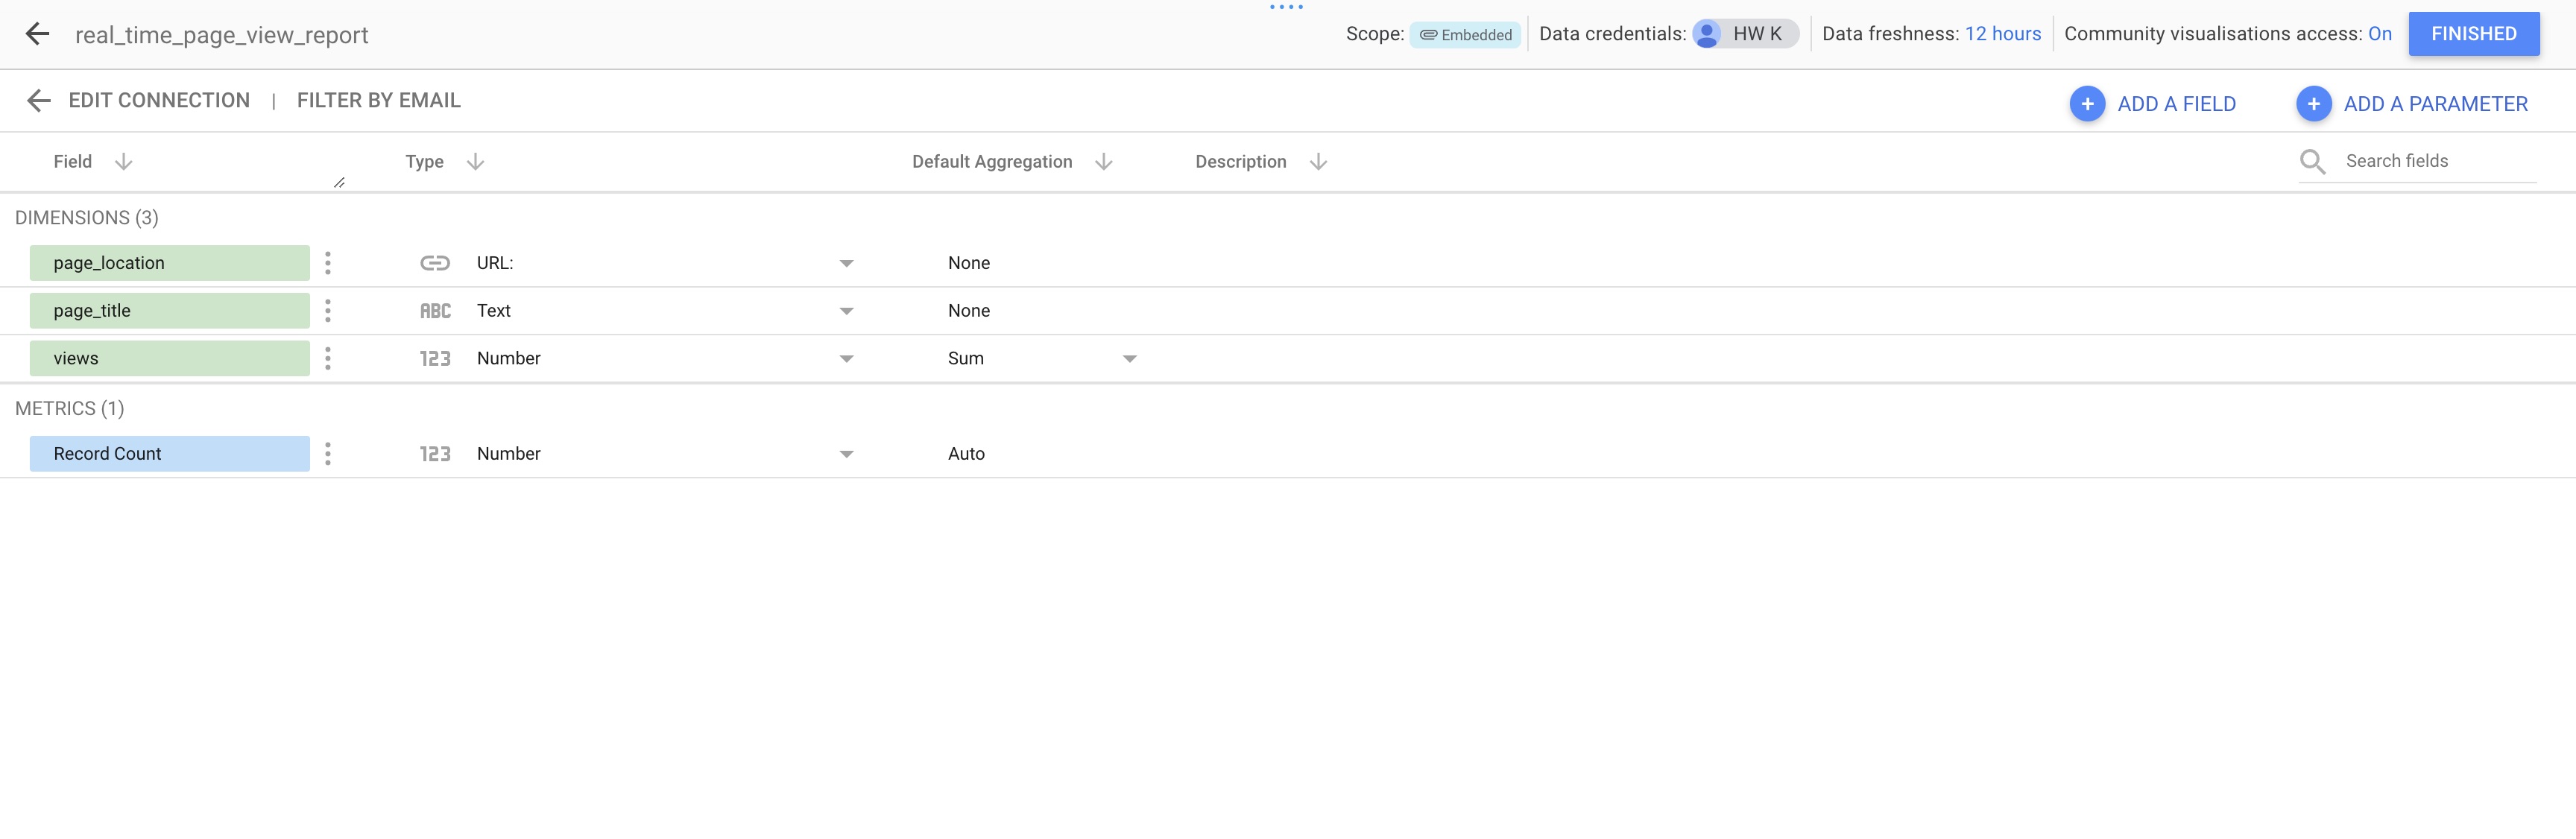
Step16: Go to edit the data source
Step17: Update the freshness
on the top right hand corner, click data freshness
Step18: Update the freshness to every 15 mins:
Click to select the freshness to every 15 mins.
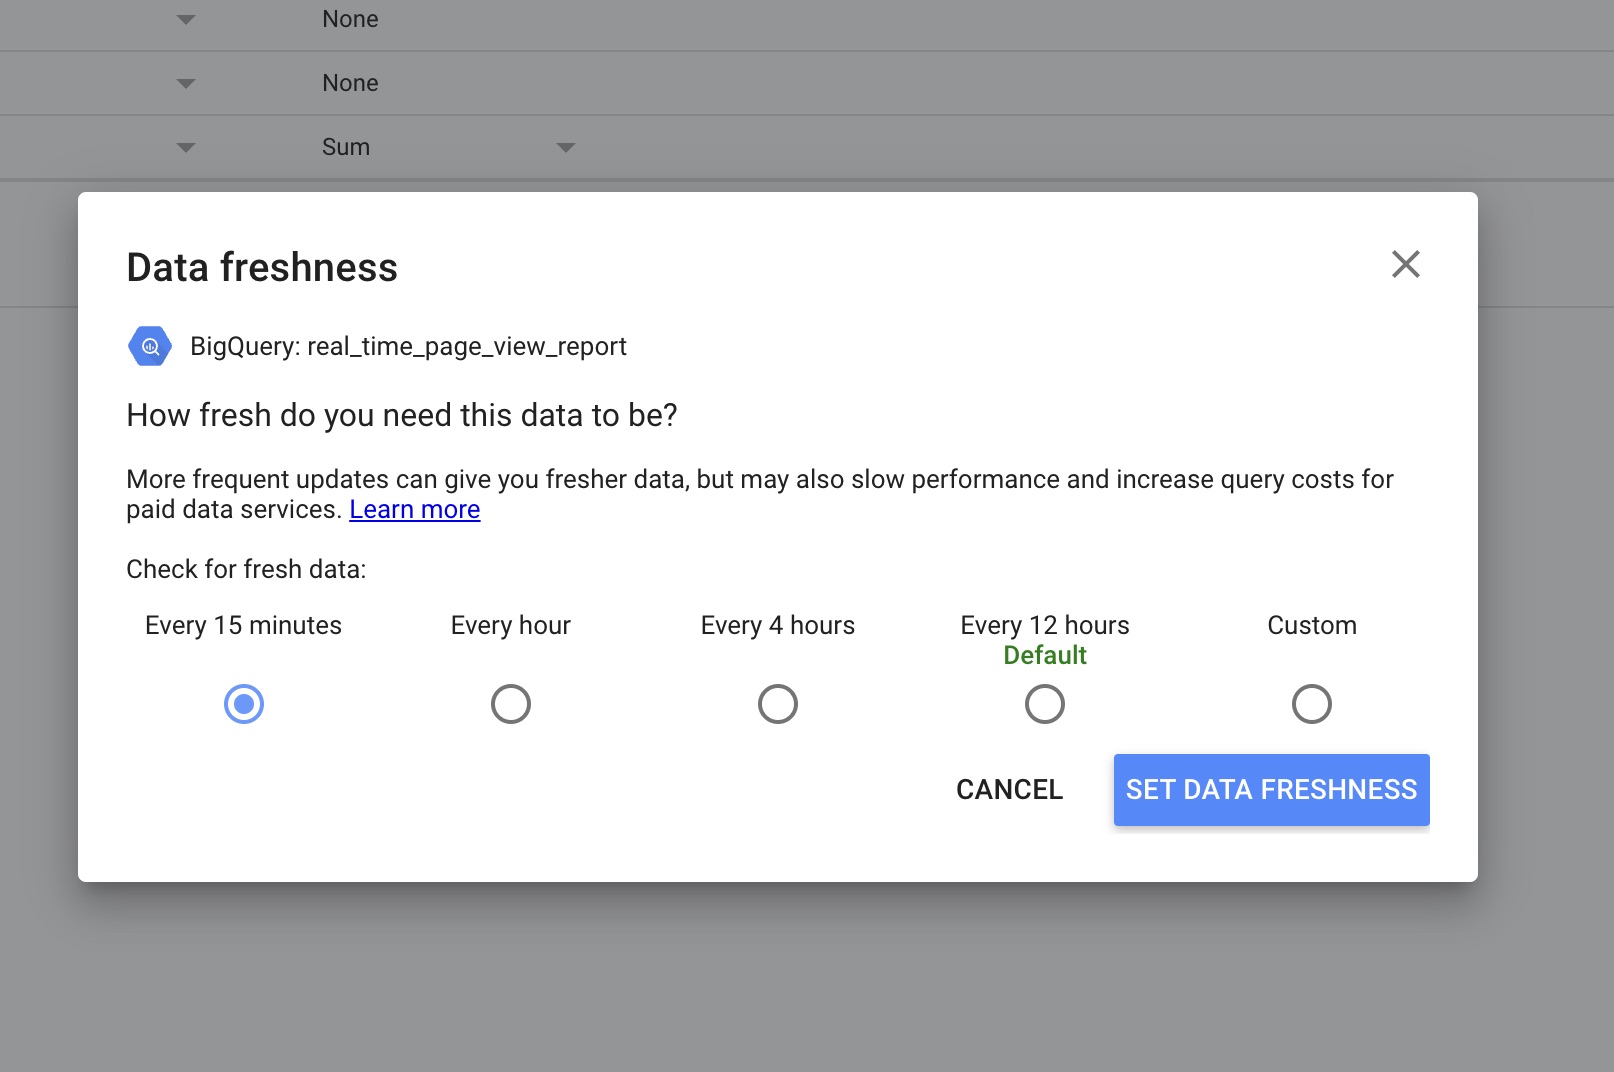
There you go! If you managed to follow all the steps, now you will be having a simple page view report refreshed in 15min, capturing all pageview in the past 60 min in your website. Congratulations!